


The Axie Infinite coin chart showed the prices resonated in a descending triangle pattern for nearly four months. In theory, the lower high formation within this pattern accentuates losing of bullish momentum. Finally, the breakdown below the neckline support will signal the sellers have wrestled the trend control.
Key points:
- The Axie infinite coin shows a 16.5% loss within a fortnight
- Under the influence of the aforementioned pattern, the altcoin lose $12.6 in monthly support
- The intraday trading volume in Axie infinity (AXS) coin is $12.3.4 Million, indicating a 2.28% gain.
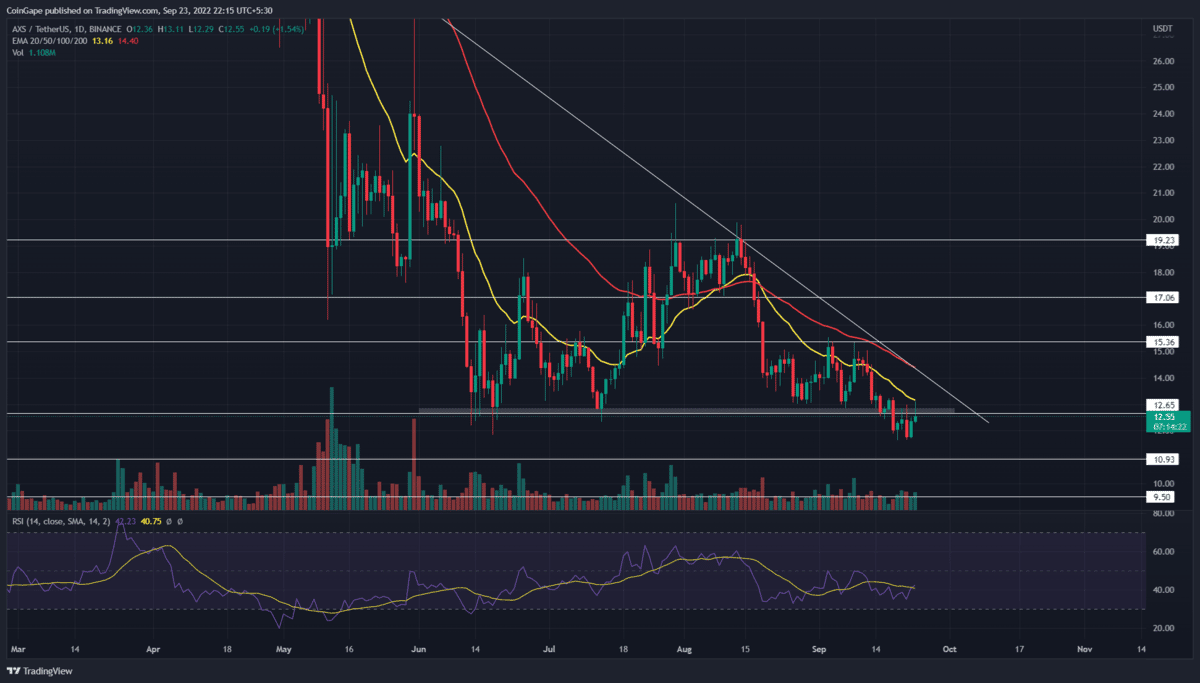
 Source- Tradingview
The recent sell-offs in the crypto market assisted the AXS sellers in completing the descending triangle pattern. On September 18th, the Axie infinite coin gave a massive breakdown from the neckline support of dollar 12.66, encouraging the resumption of the prevailing downtrend.
The altcoin has been trying to sustain below the breached support over the past five days. Moreover, the higher price rejection candles during the retest phase indicate sufficient supply pressure. Still, the volume activity rise during the retest candle reflects the buyers have not thrown the towel yet.
Therefore, the market participants may witness a new recovery rally if the buyers breach the $12.66 mark and resistance trendline within two weeks.
On a contrary note, the bullish momentum should eventually wear off if the sellers manage to hold prices below the $12.65 resistance. Furthermore, the post-retest downfall would plunge the Axie infinite coin price 24.5% lower to hit the $9.5 mark.
Technical indicator
EMA’s: the downsloping crucial EMAs(20, 50, 100, and 200) accentuate aggressive downfall. Moreover, the 20-day EMA wavering at the $13 mark assists sellers in sustaining prices below the pattern’s neckline.
RSI indicator: the indicator value below the midline suggests the current market sentiment is bearish. However, a positive divergence in the daily-RSI slope strengthens the possibility of price recovery.
Axie infinity coin Price Intraday Levels
- Spot rate: $12.58
- Trend: Bearish
- Volatility: Low
- Resistance levels- $15.3 and $17
- Support levels- $11 and $9.5
- Shiba Inu News: ShibaSwap Migrates To Shibarium Breaks Ethereum Ties
- Newly Created Wallet Withdraws $118M Worth Of Crypto From Binance
- Binance LUNC Burn: Terra Luna Classic Burn Estimates, LUNC Price to Rally?
- SHIB Price: Shiba Inu Burn Spirals 900%, Price Recovery To $0.0001 Ahead?
- Solana Co-Founder Mocks Vitalik Buterin, Defends Meme Coin Frenzy
- Optimism Price Forecast: Is $OP Ready to Hit $4?
- Bitcoin Price Analysis: Will $BTC Correction Dip Below $60K Support?
- Avalanche Price Forecast: Is a Price Recovery to $50 Realistic in Current Market?
- Dogecoin Buyers Eyes Key Triangle Pattern for Next Price Move
- Crypto Price Prediction: Key Altcoins to Watch as Bitcoin Heading to $60K


