


The Cronos coin price action shows the bullish dominance sustaining at the psychological mark of $0.10, resulting in a price jump of 16.4%. The recovery rally moves at a high momentum and challenges the 100-day ema, which may shortly provide a Bullish entry opportunity for sideline traders. So, should you consider taking a Bullish trade?
Key points:
- $11.5 resistance breakout should assist the buyer in charging at $12.633 resistance
- The daily-RSI slope shows an evident bullish divergence
- The intraday trading volume in Cronos coin is $167.2 Million, indicating an 81.26% gain.
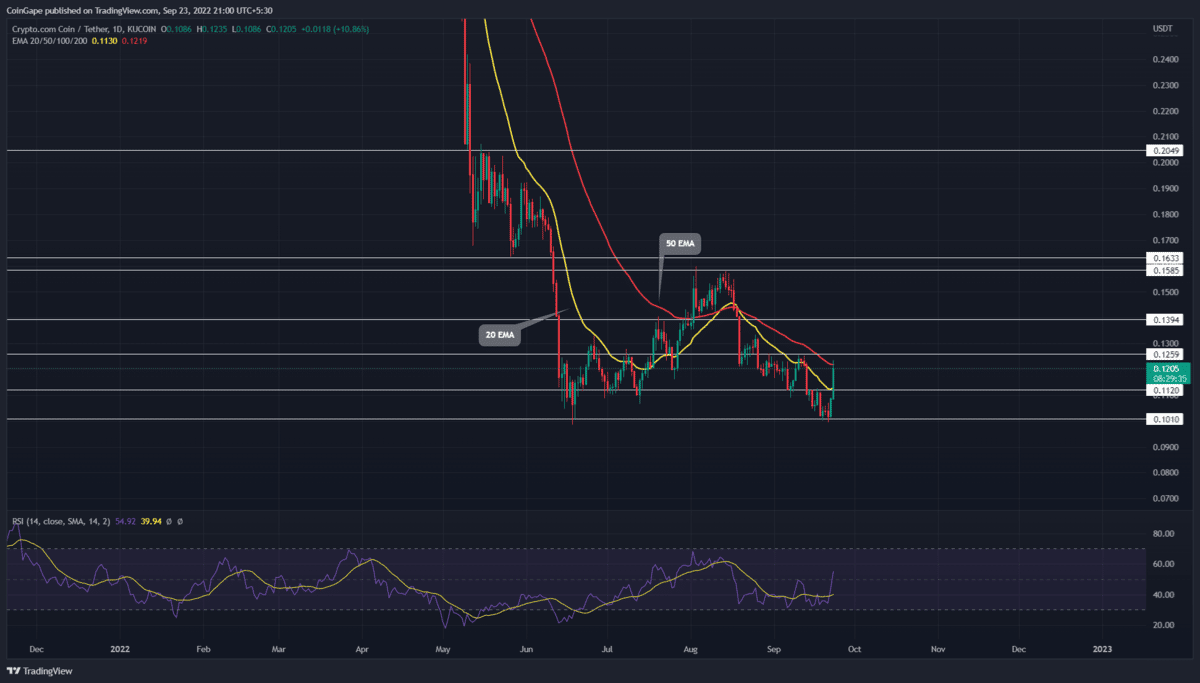
 Source- Tradingview
On September 22nd, the Cronos coin rebounded from the $0.1 psychological support with a bullish engulfing candle. This was a second reversal from the $0.1 mark during the last four months, valdating it as a strong accumulation zone.
Furthermore, concerning these two bullish reversals, the daily time frame chart shows a formation of a double-bottom pattern. This bullish reversal pattern offers a recovery set-up and a direction bullish rally if the price breach the neckline resistance.
As of now, the Cronos coin prices display the bullish engulfing candle crossing above the 20-day EMA to challenge the 50-day EMA with a spike in trading volume. Therefore, the price analysis reflects a remarkable increase in buying pressure.
Along with 20-day EMA, the bull-run breached the local resistance of $0.111, which could now act as potential support. With this new launchpad and sustained buying, the coin prices could rally 35.5% higher to $0.158-$0.163 neckline resistance. Additionally, the optimistic traders can expect a breakout of this swing high breakout, prolonging the potential rally to the $0.20 mark.
Conversely, a bullish failure to cross above the 50-day EMA will endanger the buyers at the psychological mark of $0.10.
Technical indicator
EMAs: the 20-and-50-day EMAs act as dynamic resistance to restrict bullish growth.
RSI indicator: A bullish divergence in daily-RSI slope bolsters the possibility of a double bottom pattern and recovery theory.
Cronos Coin Price Intraday Levels
- Spot rate: $0.117
- Trend: Bullish
- Volatility: Low
- Resistance levels- $0.126 and $0.14
- Support levels- $0.11 and $0.1
- Sui Network Clarifies Misconceptions About Token Supply, Will Price Rally?
- Analysts Predict Biggest Altcoin Market Rally To $4 Trillion Market Cap
- 5 Crypto Whales Aggressively Accumulate PEPE, LINK, and More
- LUNC News: Terra Luna Classic Key Proposal Fails, LUNC Price Stars Rallying
- Peter Brandt Backs Michael Saylor’s Controversial Bitcoin Is King Statement
- Bitcoin Price Analysis: End-of-Correction Pattern Hints $BTC Rally to $73k in May
- Pepe Coin Price Analysis: Will $PEPE Hit $0.00001 in the Coming Week?
- Crypto Price Prediction: Top Meme Coins to Focus As $BTC Sparks Fresh Rally Above $63k
- Uniswap Price Analysis: $UNI Eyes $10 Amid Double Bottom Reversal
- Dogecoin Price Prediction: Is $0.2 a Realistic Target in May 2024?


