


SHIB Price Analysis: Decoupling from rising FUD in the crypto market, the Shiba Inu price has shown a parabolic rally over the past two months. From a low of $0.00000543, the coin price has surged 83.6% and is currently trading at the $0.0000101 mark. This fast recovery memecoin has recently breached a psychological barrier of $0.00001 indicating the prices are poised for a higher rally.
Also Read: Shiba Inu Whales On The Move To Propel SHIB Price Rally
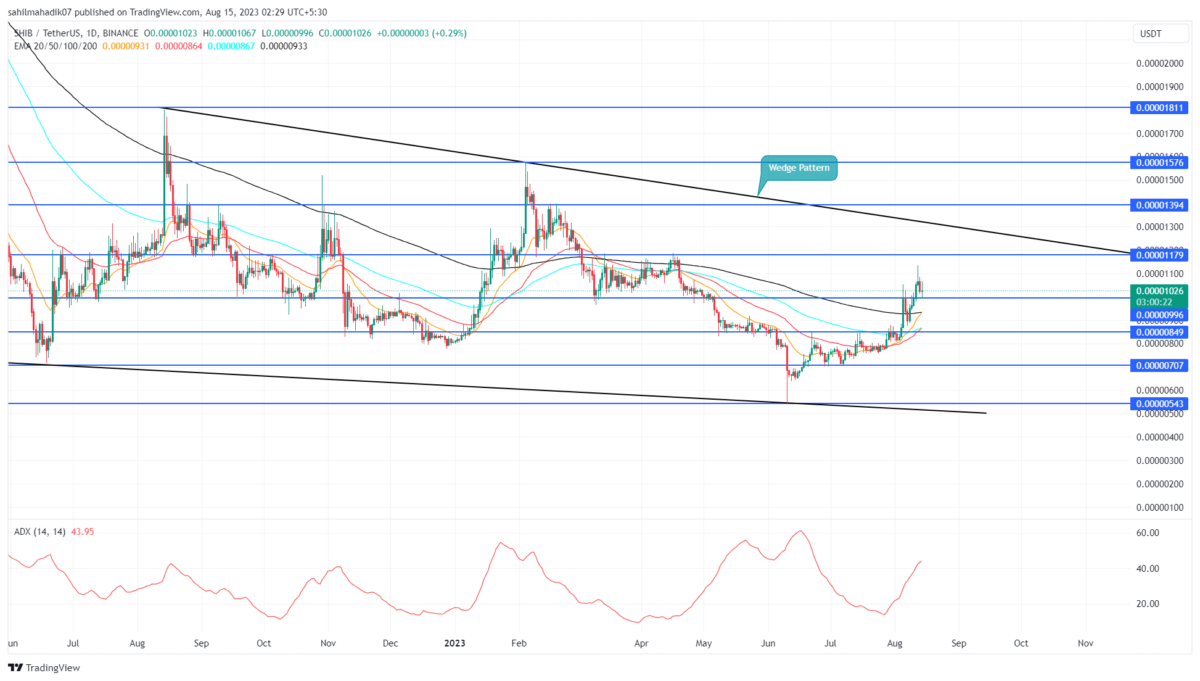
Shiba Inu Daily Chart: Key Points
- A bullish breakout from the $0.00001 barrier would trigger a significant upswing
- A positive crossover between the 20-and-200-day EMA bolsters bullish momentum
- The intraday trading volume of the Shiba Inu coin is $388.2 Million, showing a 38% gain.
 Source- Tradingview
The Shiba Inu price showed a V-shaped recovery in the daily time frame chart. This type of recovery often signals aggressive buying from market participants, offering traders an opportunity to quickly reclaim the higher grounds.
Amid this rally, the prices have breached some crucial barriers such as $0.000007, $0.0000085, and most recently $0.00001. After the aforementioned breakout, the SHIB price peaked at $0.00001136 and reverted to the retest breached level.
The market participants must keep a close eye on this retest, as the SHIB price sustainability above it would bolster further rally. Thus, with sustained buying, the memecoin may rise 25% to hit the upper trendline of the wedge pattern.
Is SHIB Price Still Threaned For Major Correction?
While the bullish sentiment persists for Shiba Inu coin, the anticipated rally of 25% would face major resistance from the upper trendline of the wedge pattern. The pattern is currently leading the downtrend in popular memecoin over the past sixteen months. The intense supply pressure at this barrier could trigger another major correction for traders.
- Exponential Moving Average: The SHIB price above daily EMAs(20, 50, 100, and 200) reflects the overall trend bullish.
- Average Directional Index: The ADX slope at 44% reflects the uptrend in reaching maturity.
- Litecoin Whale Accumulation Surges, LTC Price Breakout Above $100 Imminent?
- Bitcoin Price Today: Exchange Supply Hits Low At 1.7M BTC Ahead ETF Second Wave
- Render Price Slips As Whale Offloads $3M RNDR, What’s Next?
- Cardano Founder Charles Hoskinson Backs Elon Musk Amid $55B Tesla Pay Fiasco
- Gold and Silver Hit New Record Highs, Will BTC Catch Up Soon?
- Crypto Price Analysis 20/5: Altcoins See Higher Rally As BTC Holds Strong Above $66,000
- Shiba Inu Coin Price Forecast Amid Skyrocketing Burn Rate, $0.00005 SHIB Before June?
- 5th Scape (5SCAPE) Price Prediction 2024, 2025, 2030
- Solana Price Analysis: Can SOL Surge Past $200 in the Coming Week?
- Bitcoin Price Analysis: Whale Accumulation Near Pre-FTX Levels Sets BTC Rally to $74K


