


Under the influence of a falling channel pattern, the Uniswap token price showed a steady downfall in the past five weeks. However, the very nature of this pattern is to resume a strong bull rally once the price breaks the overhead trendline. Thus, interested buyers must wait for pattern breakout to get the right entry opportunity.
Key points Uniswap token price analysis:
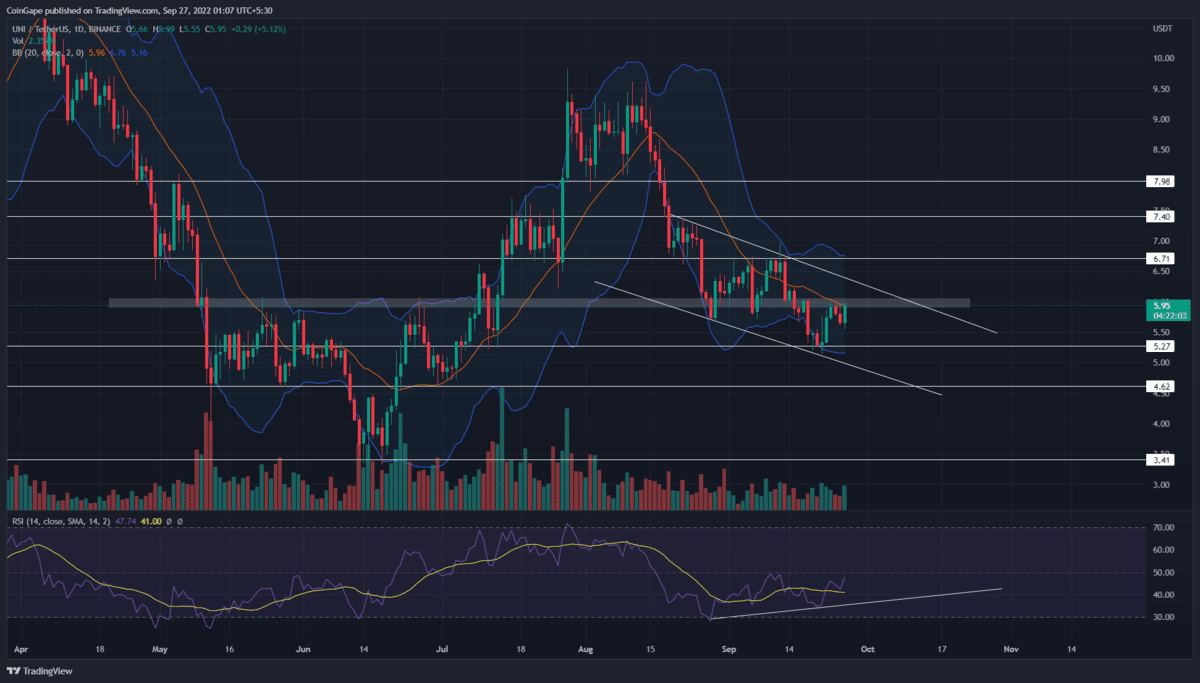
- The UNI price will continue its downward spiral until the falling channel pattern is intact
- A bullish RSI divergence suggests the UNI prices may soon witness a significant recovery
- The 24-hour trading volume in the Uniswap token is $120 Million, indicating a 88% gain.
 Source-Tradingview
The recent correction in the crypto market plunged the Uniswap token to local support of $5.27. The downfall has offset nearly 70% of gains obtained during the previous recovery rally. The coin price rebounded from the $5.27 support and initiated a minor pullback.
The price reversal soared the Uniswap token price by 14.3% and retested the $6 level as potential resistance. Last three days, the coin chart showed a higher price rejection candle at the $6 resistance, indicating the sellers are aggressively deafening this level.
Moreover, the daily time frame chart showed the formation of a falling parallel channel pattern. The resistance trendline of this pattern wavering at the $6 mark offers an additional hurdle against the bullish growth.
This confluence resistance could exert significant selling pressure on traders to revert the prices lower. As a result, the potential reversal will indicate the resumption of prevailing correction and tumble of the Uniswap token price by 10.84% to break the $5.27.
On a contrary note, the technical setup indicates the coin price should eventually breach the resistance trendline to trigger a new recovery rally.
Technical indicator
RSI indicator: the daily-RSI slope shows an evident bullish divergence concerning the last two lower lows in price action. This divergence indicates growth in bullish momentum and a better possibility for the bullish breakout from the channel pattern.
Bollinger band indicator: the coin price retest to the indicator’s midline will encourage downfall continuation.
- Resistance levels- $6, $6.7
- Support levels- $5.27 and $4.65
- Arthur Hayes Predicts ENA to Hit $10 as Bybit Integrates USDe
- Top Analyst Explains Why Bitcoin Price Will Top $477K
- Just-In: Shiba Inu (SHIB) Bags Nexo Listing, Will SHIB Price Rally
- Bitcoin & ETH Records $251M Outflow Last Week, But There’s A Catch
- Just-In: QCP Capital Expands To Abu Dhabi With Initial Regulatory Approval
- Pepe Coin Price Analysis As Trading Volume Plunges 20% To $742M, Is 2024 Bull Run Over?
- BTC/USD: Bitcoin Call Options Hit 172K As Bitcoin Bags $64,000, $100K Incoming?
- Crypto Price Prediction 7/5: Altcoins to Focus If Market Enters Post-Halving Rally
- SHIB Price Prediction: As Trading Volume Spikes 68%, Will Shiba Inu Coin Price Rally?
- Cardano Price Prediction: Could ADA Hit $1 This Year?


