Shiba Inu forms a bearish structure; here’s how you can benefit

Disclaimer: The findings of the following analysis are the sole opinions of the writer and should not be considered investment advice.
Shiba Inu investors have seen the meme coin gain nearly 150% measured from the bottom in mid-May to the top in mid-August.
At the time of writing, a chunk of these gains had been retraced over the past month.
The SHIB burn rate spiked last week but saw a massive slowdown over the past 24 hours. On the price charts, the bears have forced a decent drop and further losses could arrive over the next week.
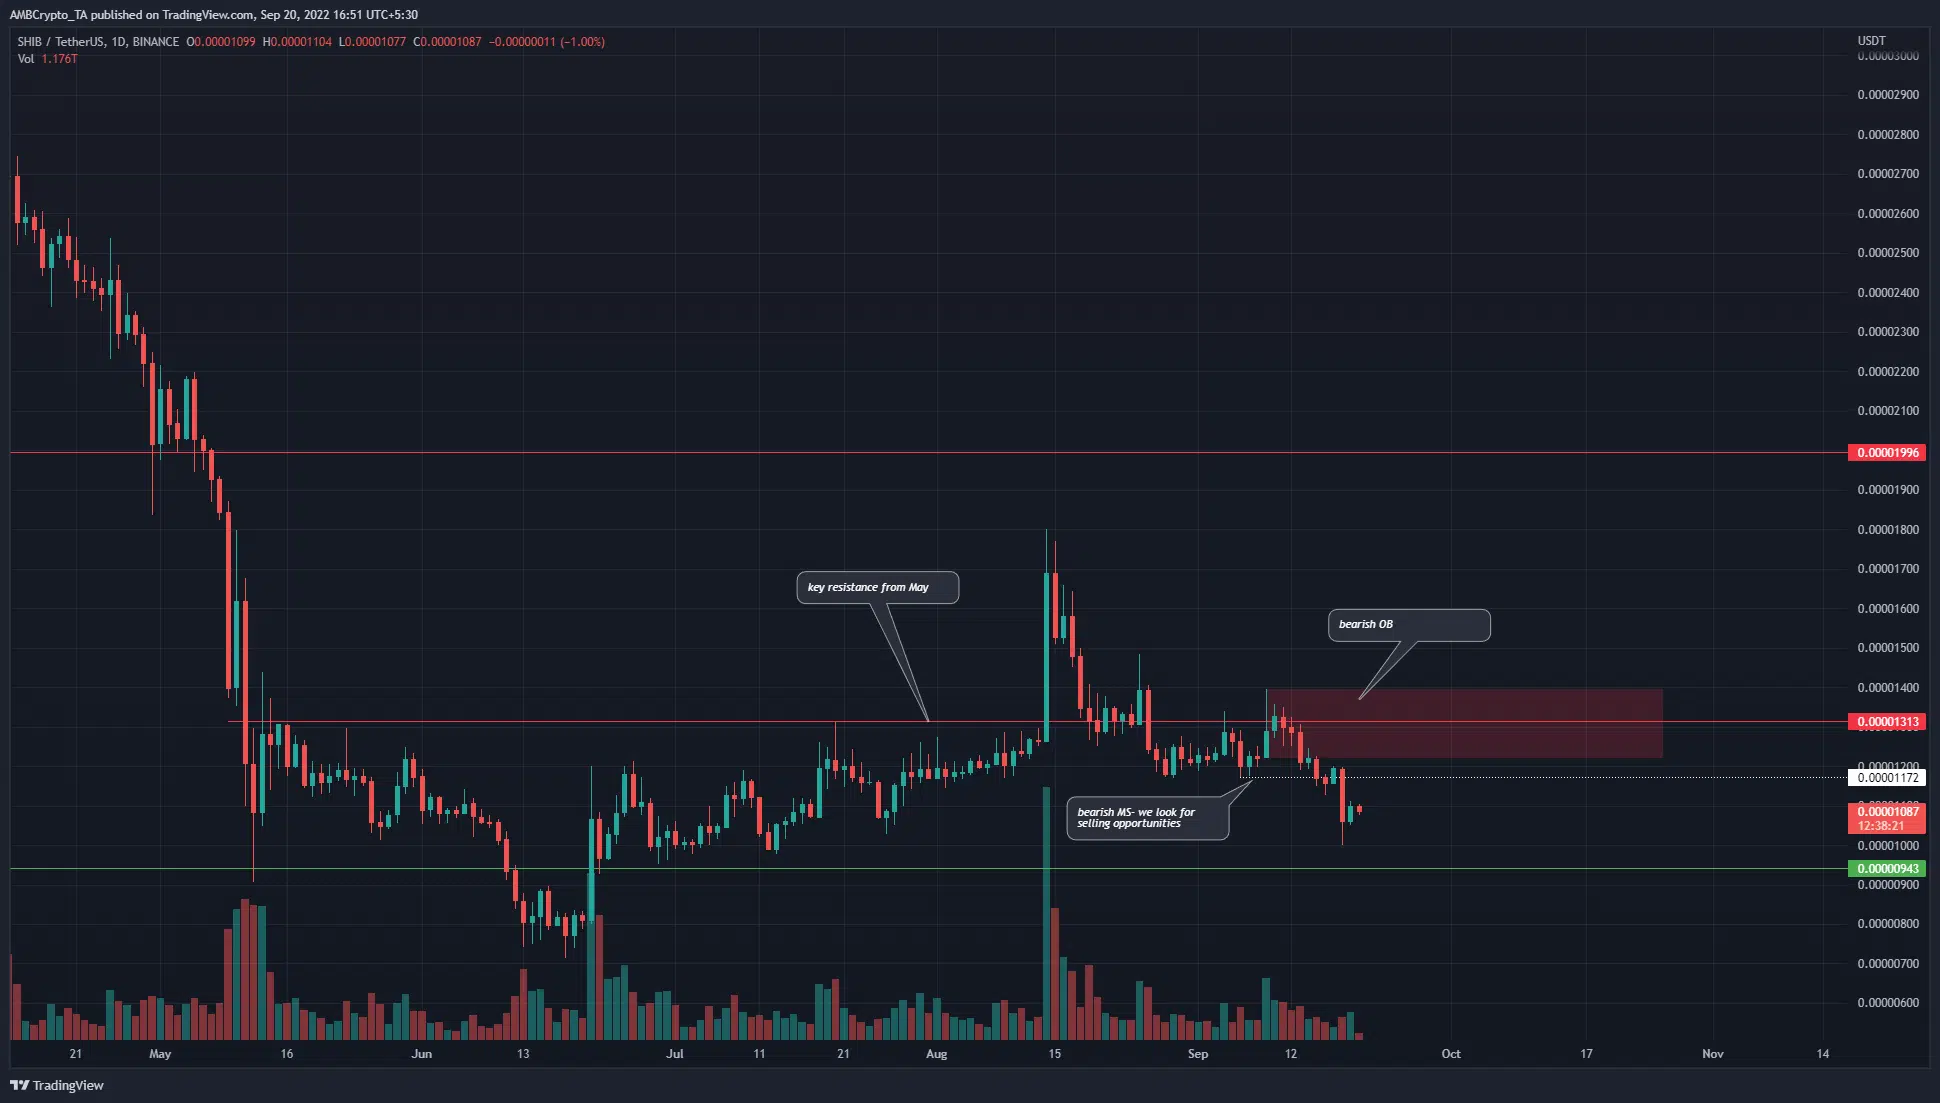
SHIB- 1-Day Chart
The daily timeframe showed the market to take a bullish turn in July and especially August. In July the price formed higher lows, but August saw SHIB break decisively past the $0.00001313 resistance.
A few days after this sharp move upward, the same level was flipped back to resistance. At the time of writing, the most recent lows at $0.00001172 have been breached, and the market structure flipped to bearish on this higher timeframe.
Hence, traders can look for selling or shorting opportunities in the days to come.
The red box highlighted a bearish order block for SHIB. A move upward into this zone can be used to enter short positions.
Rationale
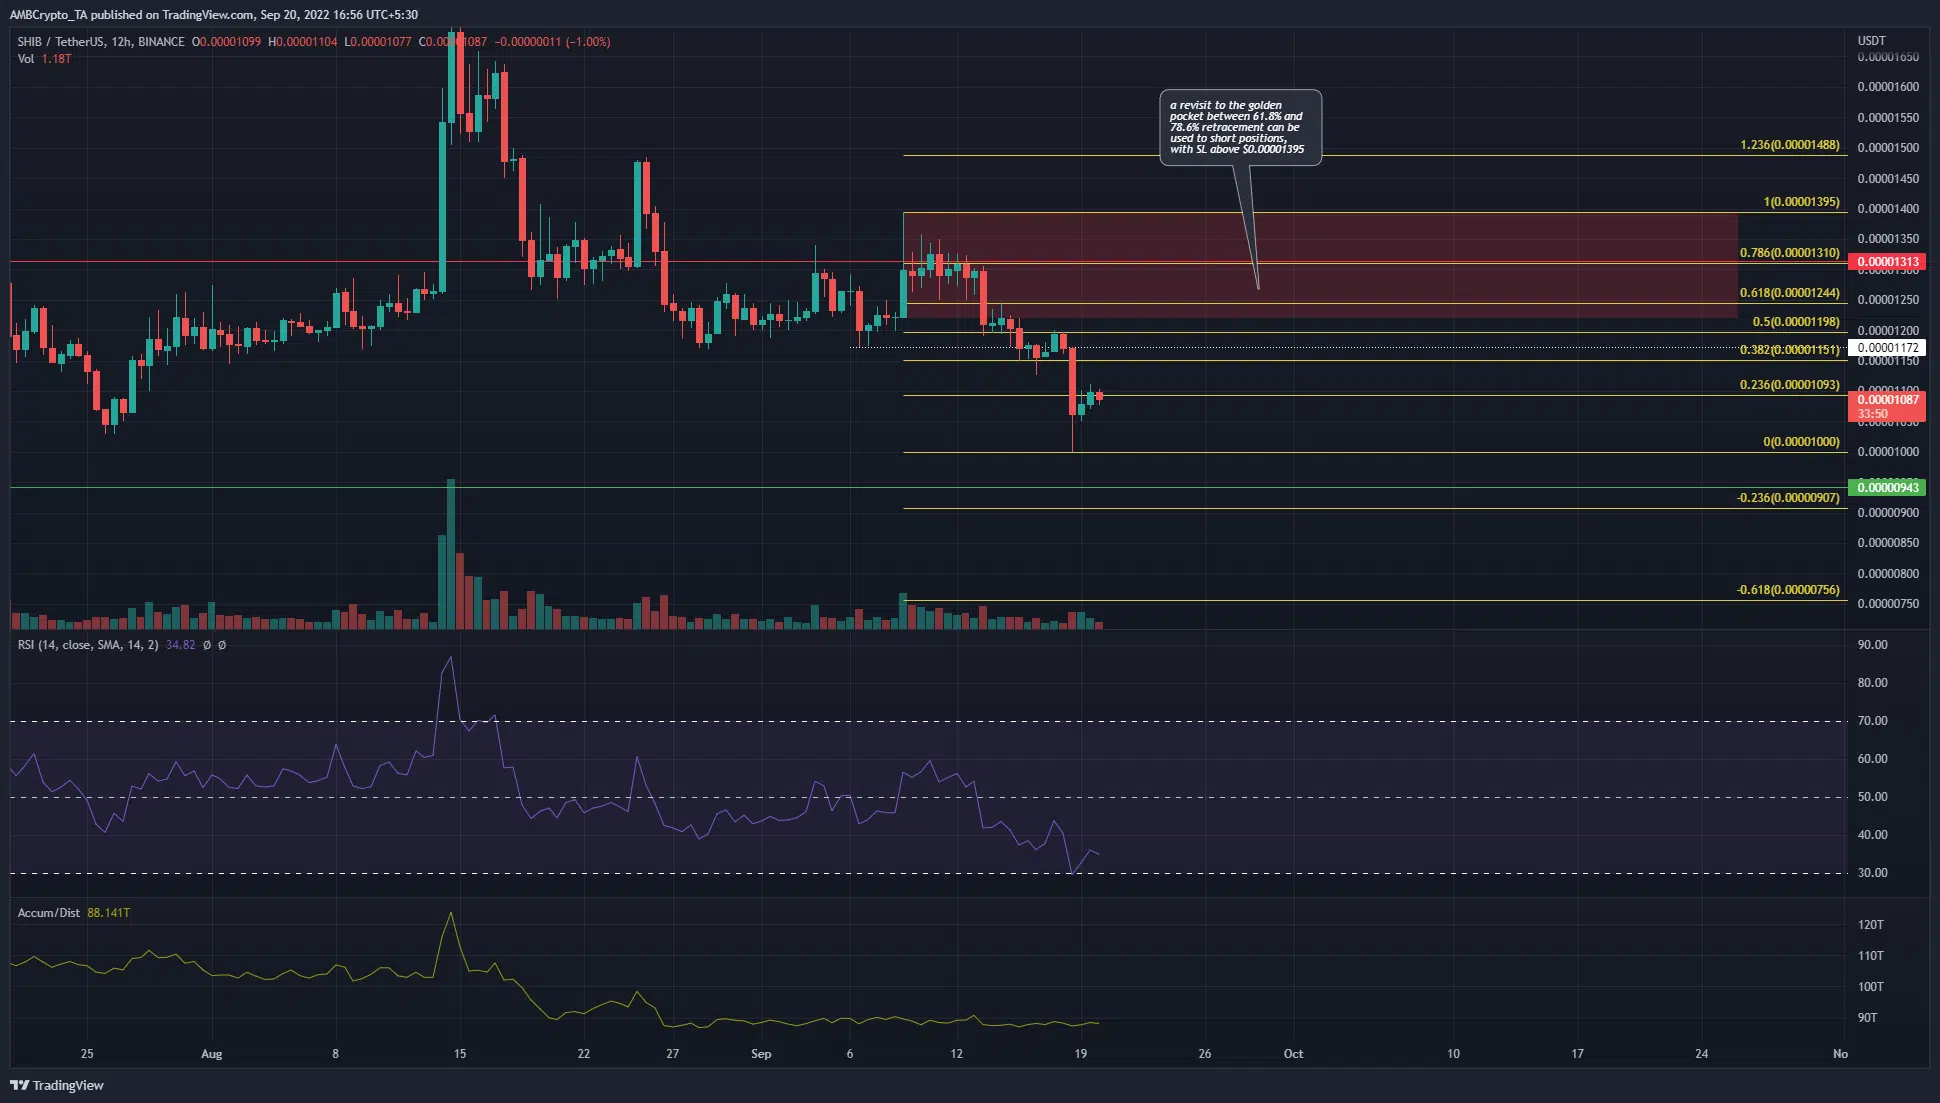
On the 12-hour chart, a set of Fibonacci retracement levels were drawn (yellow). It showed the 61.8% and 78.6% retracement levels to lie squarely within the bearish order block.
Therefore there was a good confluence between the Fibonacci retracement levels and the bearish order block, as both will oppose a SHIB move past $0.0000131.
This order block has also formed near the key resistance level at $0.00001313, making another rejection for SHIB likely.
The RSI was below neutral 50 to show strong downward momentum. The A/D line has been flat in September but trended downward in late August. When zoomed out, the same indicator has been in decline since November with occasional jumps upward.
Conclusion
The price charts suggested that a bounce toward the $0.0000131 region would likely be followed by a deeper move downward for Shiba Inu.
Invalidation of this idea would be a daily trading session close above the order block, at $0.00001395. A move back down to $0.00001 can be used to take profits.


