


Since Tradeteq’s tokenized US Treasury offering debuted on Tuesday’s layer 1 blockchain XDC Network, positive momentum has been dominant. As a result, the XDC price increased from an intra-day low of $0.05929 in the previous 24 hours to a 7-day high of $0.06659 before encountering resistance.
This price increase may be attributed to increased interest, demand for tokenized US Treasury offerings, and the market’s positive outlook. If the $0.06659 resistance level is broken, the next resistance level for the XDC price might be around $0.07000. However, a pullback or consolidation period may occur before the price resumes its upward rally.
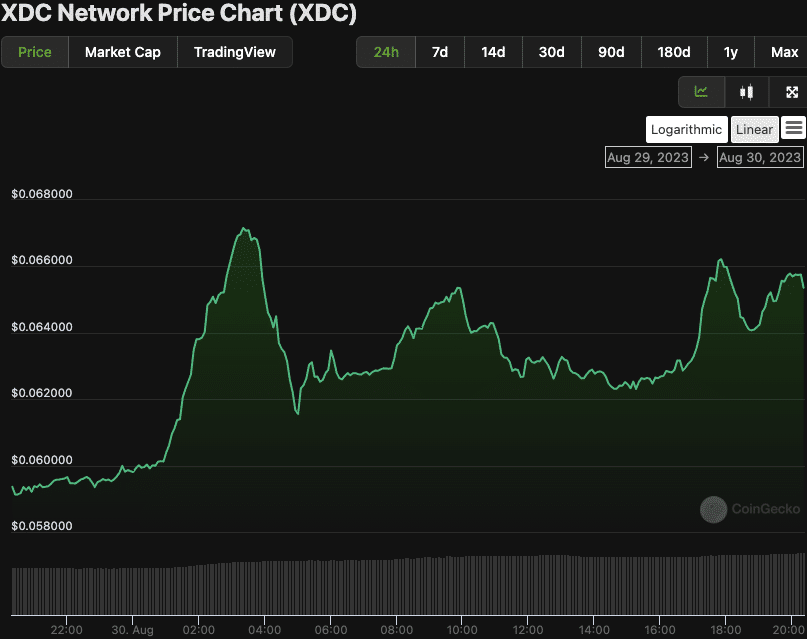
XDC/USD 1-day price chart (source: CoinGecko)
During the bull run, XDC’s market capitalization and 24-hour trading volume increased by 8.48% and 30.47%, respectively, to $895,110,754 and $14,775,539. This increase shows a significant flood of investors and trading activity in XDC, further supporting its rising trend.
Recommended Articles


XDC Technical Analysis
The Bollinger bands on the 4-hour price chart are broadening and rising higher, indicating the possibility of more volatility and upward movement in XDC’s price. The upper and lower Bollinger band intersections at $0.06850202 and $0.04627758, respectively, evidence the bullish trend.
With the price action near the upper band, XDC is currently trading at a relatively high level and may experience a temporary pullback or consolidation before potentially continuing its upward trend.
 Source: TradingView
Furthermore, with a reading of 57.22, the stochastic RSI is moving below its signal line and drifting south, indicating a likely decline in purchasing pressure. This pattern lends credence to a possible price drop for XDC, as investors may take profits and wait for a better entry time.
Additionally, the Relative Strength Index at 68.14, XDC is approaching overbought territory, indicating that the current uptrend is losing steam, and a correction may be coming. If the RSI remains above 70, it will reinforce the overbought situation and raise the chances of a market reversal.
While XDC’s positive momentum is evident, caution is advised as indicators suggest a potential pullback due to profit-taking and overbought signals.
- Bitcoin Runes Sees Slowdown in Activity After Initial Surge
- Bitcoin Trading Slows as On-Chain Activity Nears Historic Lows
- Cardano Founder Charles Hoskinson Reveals Why Crypto Matters In Choosing Next US President
- Analysts Urge Bitcoin, Gold & Silver Buy as Elon Musk Critiques FED’s Money Printing
- Charles Hoskinson Criticizes “Incompetent” WEF Contributor Stance on Bitcoin
- Top 4 Crypto To Sell To Avoid Being A Poor Crypto Investor
- Dogecoin Price Prediction: Can Recent Whale Movement Push Value to $0.3?
- XRP Price Analysis As SEC Legal Battle Looms: Will $0.5 Support Hold Firm?
- Toncoin Price Forecast: Is $TON Recovery Heading to $10 in May?
- Can These 3 Altcoins To Buy In May Make You Rich In 2024

 Mallconomy


