


Despite being a bearish pattern, the rising parallel channel led the MATIC price to $1 resistance. Moreover, this resistance is the neckline of a cup and handle pattern holds significant weightage to determine the future market price. Thus, the coin holder should closely watch the price action near the $1 mark.
Key points from MATIC price analysis
- The support trendline carries the ongoing recovery in MATIC price
- The 50-and-100-day EMA on the verge of bullish crossover may attract more buyers to the market
- The intraday trading volume in the MATIC is $748.3 Million, indicating a 24.5% gain
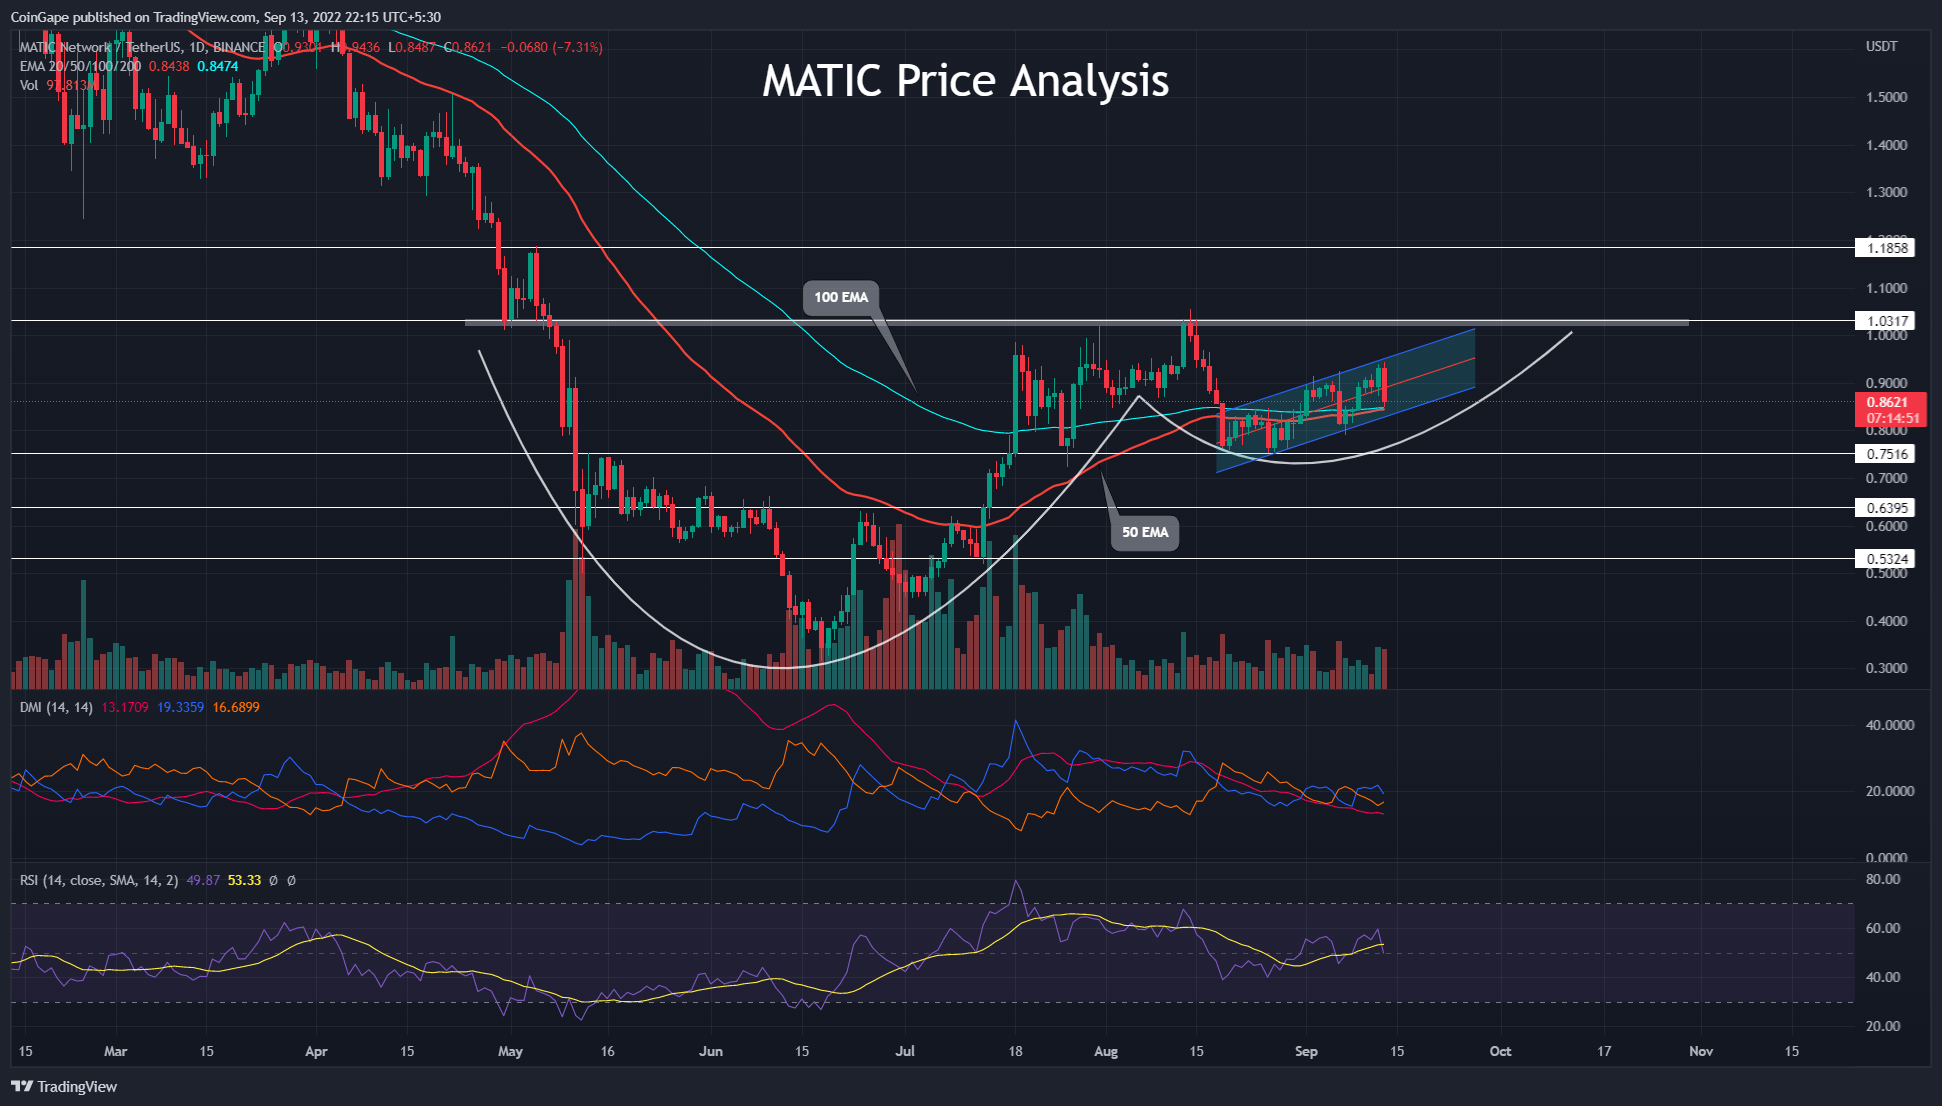
 Source- –Tradingview
In late August, the MATIC prices took a bullish reversal from the $0.75 support level, resulting in a rising channel pattern, accounting for a 25% jump. As a result, the bull cycle beats the 50-and-100-day EMA but struggles to reach the psychological mark of $1.0.
Taking the larger picture into account, the price action reveals a cup and handle pattern in the daily chart with a neckline at the psychological mark of $1.0. The ongoing bull cycle projects the possibility of pattern completion, which may shortly result in a bullish breakout if the buying pressure sustains.
However, amid today’s sell-off, the MATIC price tumbled 7.3% and shows a bearish engulfing candle in the rising channel.
Coming to the intraday trading volumes, the bearish engulfing candle finds seller commitment, teasing a rising channel fallout. If the prices manage to close below the support trendline, MATIC traders can find a short-term selling opportunity with a target of the $0.75 support level. Furthermore, if the increased selling pressure breaks the $0.75 level, a prolonged correction might test the psychological mark of $0.50.
However, an uptrend continuation reaching the psychological mark of $1.0 will increase the breakout possibility. And the unleashed bullish momentum upon successful breakout can test the overhead resistance of $1.30, accounting for a 30% jump.
Technical Indicators
DMI: due to the recent sell-off, the DI lines reverse sharply, indicating a bearish crossover possibility. And the falling adx line maintains the signal of weak Trend momentum.
Relative Strength Index: A steady growth in daily-RSI slope dips to the halfway line cracking under the 14-day SMA. Hence the Technical indicators maintain a slightly bearish viewpoint for MATIC.
- Resistance levels- $1 and $1.18
- Support levels-
- $0.815 and $0.75
- 10 Years Old Dogecoin Stash Sale Leaves DOGE Owner With Million-Dollar Loss
- Binance To Cease Support For These BTC & Other Crypto Pairs
- Bitcoin ETF Sees $100M Influx Signaling Positive Road Ahead
- Canada Banking Giants Pour Millions Into Bitcoin ETF Amid Inflow Resurgence
- ETH Price: Fresh Wallet Scoops Up 29K Coins From Coinbase, What’s Next?
- Polygon Price Forecast: Will the Symmetrical Triangle Formation Spur a Bullish Trend?
- Terra Classic Price Analysis As Coinbase Mulls Relisting LUNC: Can LUNC 100X From Here
- Solana Price Analysis: Flag Pattern Suggests Imminent Breakout Rally to $200
- 2 Meme Coins To Buy As PEPE Ignites 100X Surge In 2024
- 5 Altcoins To Buy On The Brink Of Rocketing $10,000 Into $1,0000,000 This Month


