Trapped FTT Price Eyes 50% Jump, Is Breakout Imminent?
Author: Sohrab Khawas 
Sohrab Khawas 
Author
Sohrab is a passionate cryptocurrency news writer with over five years of experience covering the industry. He keeps a keen interest in blockchain technology and its potential to revolutionize finance. Whether he's trading or writing, Sohrab always keeps his finger on the pulse of the crypto world, using his expertise to deliver informative and engaging articles that educate and inspire. When he's not analyzing the markets, Sohrab indulges in his hobbies of graphic design, minimal design or listening to his favorite hip-hop tunes.

Nov 29, 2023 14:24
Sohrab Khawas

Author
Sohrab is a passionate cryptocurrency news writer with over five years of experience covering the industry. He keeps a keen interest in blockchain technology and its potential to revolutionize finance. Whether he's trading or writing, Sohrab always keeps his finger on the pulse of the crypto world, using his expertise to deliver informative and engaging articles that educate and inspire. When he's not analyzing the markets, Sohrab indulges in his hobbies of graphic design, minimal design or listening to his favorite hip-hop tunes.
FTT price action shows a bullish trend continuation and forms a triangle in the 4H chart.
With the ongoing positive cycle, the FTT price prepares for a bullish breakout to prolong the uptrend.
Considering the uptrend exceeds $4.5, the breakout rally can reach the $6.30 mark.
Making it to headlines, the FTT price recovery rally is quickly gaining traction amongst the altcoins and eyes a new breakout rally. Despite being infamous in the market, the FTX token is sustaining a short-term uptrend in the price chart.
Further, the bullish pattern formation in the 4H chart teases an uptrend continuation for the FTT price. Providing entry points for traders with the precision of sharpshooters, should you consider buying FTX Token before 2023 ends?
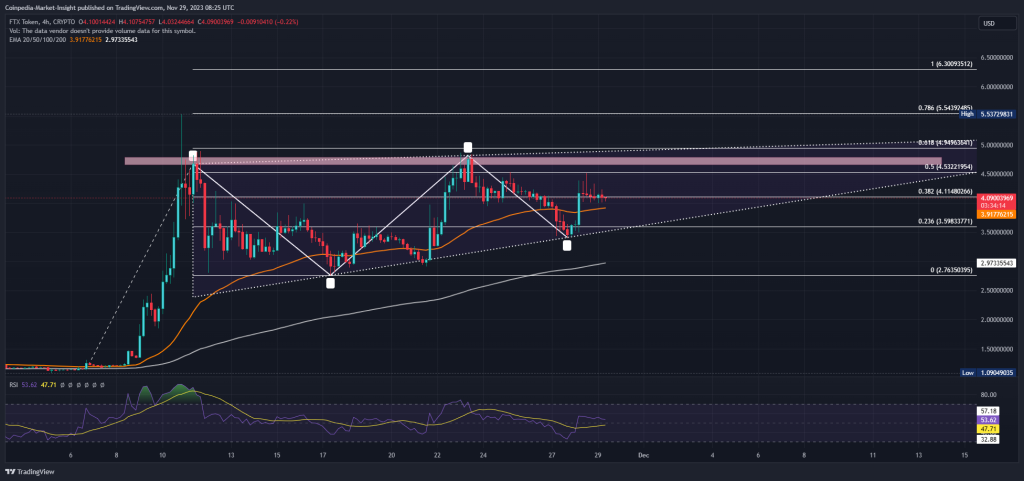
Source – Tradingview
Making a recovery of 283% between November 8th to November 11th, the FTT price reclaims the $4.5 mark. However, the overhead supply zone at $4.67-$4.70 brings excessive inflow pressure to pipe down the recovery phase.
Entering a cool-off phase, the altcoin moves on a lateral trend to form a triangle pattern with the overhead resistance at $4.70. The ongoing positive cycle within the triangle pattern teases a high breakout possibility.
Currently, the FTT price trades at $4.07 following last night’s jump of 12.94%, the buyers are preparing to take back the trend control. Considering the buyers manage to sustain the pressure, the breakout possibility will increase significantly.
Technical indicators:
RSI: The declining trend in the RSI line bounces back in the 4H chart as it crosses above the 14-day SMA. Further, the uptrend approaches the overbought boundary with no visible divergences.
EMA: The golden crossover event in the daily chart puts the 50D and 200D EMA back into positive alignment. Further, the uptrending average lines may soon provide dynamic support to any minor corrections.
Will FTT Price Reach $2?
The overall FTT price action reflects a high possibility of a triangle breakout rally ready to push the market price significantly higher. Moreover, the breakout rally shows the potential to cross above the $6 mark. Considering the uptrend sustains momentum, the FTX token price can reach the $6.30 mark.
On the flip side, a reversal under $3.59 will result in a downtrend to $2.76.