DOT Price Ignites A Dynamic Recovery With 21% Jump, Eyes $10!
Author: Sohrab Khawas 
Sohrab Khawas 
Author
Sohrab is a passionate cryptocurrency news writer with over five years of experience covering the industry. He keeps a keen interest in blockchain technology and its potential to revolutionize finance. Whether he's trading or writing, Sohrab always keeps his finger on the pulse of the crypto world, using his expertise to deliver informative and engaging articles that educate and inspire. When he's not analyzing the markets, Sohrab indulges in his hobbies of graphic design, minimal design or listening to his favorite hip-hop tunes.

Dec 22, 2023 13:28
Sohrab Khawas

Author
Sohrab is a passionate cryptocurrency news writer with over five years of experience covering the industry. He keeps a keen interest in blockchain technology and its potential to revolutionize finance. Whether he's trading or writing, Sohrab always keeps his finger on the pulse of the crypto world, using his expertise to deliver informative and engaging articles that educate and inspire. When he's not analyzing the markets, Sohrab indulges in his hobbies of graphic design, minimal design or listening to his favorite hip-hop tunes.
DOT price action high-speed overnight recovery of 21% jump, igniting a bull run.
The channel breakout rally in the weekly chart fuels the DOT price uptrend.
The ongoing recovery rally can push the DOT price beyond $10 if the uptrend sustains momentum.
Rising the ranks in the top gainers chart with a boom in its market cap, the DOT price trend displays a remarkable comeback to the end of 2023. With the buyers pumped up by the channel breakout in the weekly chart, the bullish sentiments around Polkadot are on the rise.
With the reversal rally concluding the long-term downtrend, the DOT price is gaining momentum and aims to reach $10. Further, as the overall market recovery is gaining traction, the Polkadot price prediction signals a further bullish recovery.
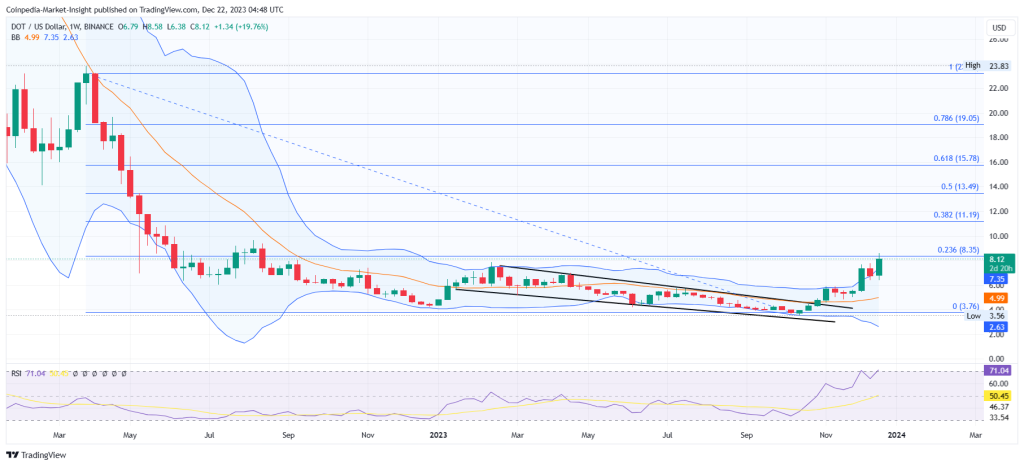
Source – Tradingview
Bouncing back from the lowest-ever point of 2023 at the $3.56 mark, the DOT price shows a remarkable recovery of 94% in the last three months. Further, the trend reversal marks the falling channel breakout rally in the weekly chart to exceed the 50W EMA.
The breakout rally challenges the 23.60% Fibonacci retracement level in the weekly chart and teases a continuation of the bullish trend. This recovery marks the end of lower high formation and may shortly unleash the trapped bullish momentum with this breakout.
Further, the recent 20% overnight jump in DOT price leads to an impressive bullish engulfing candle. Currently, the Polkadot price trades at $8.01 with an intraday fall of 4.87%, reflecting an intense pullback as bulls get exhausted.
Technical Indicators:
RSI indicator: The daily RSI line rises with the ongoing recovery, surpassing the 14-day SMA and the overbought boundary. The bullish scale remains more robust, with the momentum indicator approaching the overbought boundary.
Will The DOT Price Reach $8 This Year?
As altcoins prepare to skyrocket and end 2023 on a high note, DOT price exits the bearish path and enters the bullish highway. With the ongoing breakout rally and bullish preparations to extend the uptrend, Polkadot’s price may reach $10 if it maintains above the $8 level.
In contrast, a downtrend will test the 50D EMA or the $6 level.