


The ongoing recovery rally in APE price stalled at $7.23 resistance. Despite showcasing several attempts to breach this barrier, the buyers couldn’t surpass the $7.23 mark in the past four days. Even today, the coin price is 3.75% up, but the long rejection attached to it indicates another failed attempt from buyers.
Key points:
- The $7.23 breakout would trigger a directional rally in APE
- A breakdown below $5.52 would imply weakness in buyers’ commitment
- The intraday trading volume in the APE is $575.5 Million, indicating a 53.4% gain
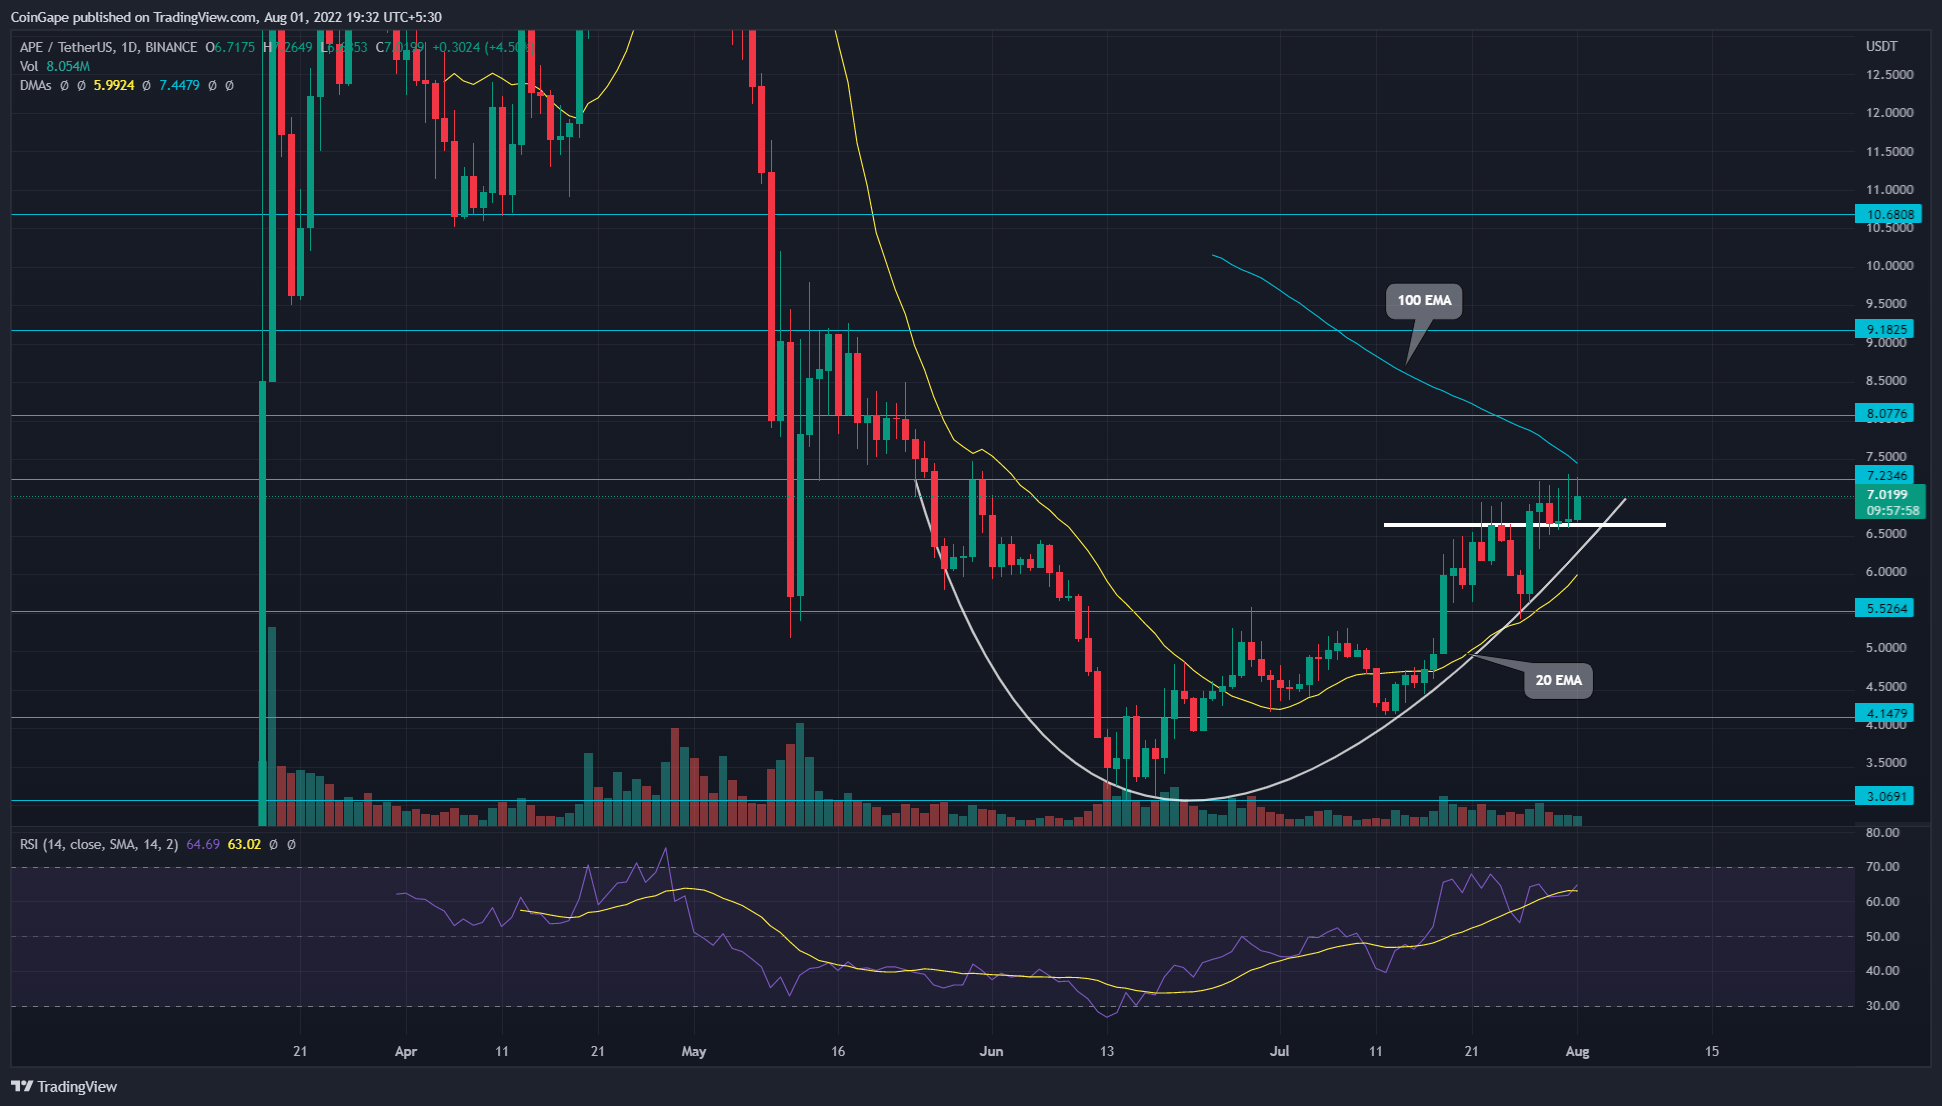 Source- Tradingview
The APE/USDT downfall took a complete turnaround after the price hit a $3.09 low. Amidst the improving market sentiment, the price action knocked out multiple resistance levels and showed a constant rally since last month.
On July 28, the bull-run tagged the $7.23 mark, registering a 138% growth since the mentioned low. However, the APE price showed several attempts to breach the overhead resistance, but all ended with long-wick rejection candles.
These failed trials hint the bullish momentum is exhausted, and the price may witness a significant correction before resuming the recovery rally. Furthermore, the price action shows a minor support level at the $6.63 mark, indicating a narrow consolidation.
Therefore, the daily candlestick closing beyond either barrier of the constitution will determine further movement in APE price.
Thus, if the sellers pull the altcoin below the $6.63 support, the traders may witness a 17% correction to the $5.52 support. However, losing this support would indicate weakness in bullish momentum, leading to further downfall to the $4.14 mark.
On the other hand, a candle closing above the $7.23 resistance will offer another breakout opportunity to buyers with a 26.7% higher target of $9.18.
Technical indicator
EMAs- The downsloping 100 DMA line is nearing to APE price would add additional selling pressure on traders. On the flip side, the short-term recovery is led by the dynamic support of the 20 DMA.
RSI indicator– a slight bearish divergence in RSI slope concerning the new higher high in price supports the pullback theory.
- Resistance levels- $7.23 and $8
- Support levels- $6.63 and $5.2
- Will the U.S. SEC Bypass ‘Security’ Concerns to Approve Spot Ethereum ETF?
- Pro-XRP Lawyer Says SEC Knows Ripple ODL Sales Are Not Investment Contracts
- Altcoins From the Ethereum Ecosystem Rally By 20%, Bull Run Ahead?
- Crypto Prices Today May 21: Bitcoin Tops $70K Amid Robust ETF Inflows, ETH Soars 17%
- Bitcoin ETF Inflows At 7 Times Daily Supply, GBTC Inflows Continue
- Toncoin Price Forecast Hints a Risk of 25% Fall Amid Emerging Double Top Pattern
- Navigating the Upcoming Crypto Earnings Calendar: Bitcoin Price Explosive Rally To $100,000 Imminent?
- Turning $5,000 Into $500,000 By December With 4 Solana Meme Coins To Buy
- Litecoin Price Analysis: LTC Eyes $100 Mark Amidst Strong Whale Accumulation
- Ethereum Price Analysis: ETH To $4,000 While Ethereum ETF Approval Beckons?


