


For the past 15 months, the BONE ShibaSwap coin has adhered to a sideways trend, encapsulated within the confines of a symmetrical triangle pattern. A key characteristic of this pattern is its ability to restrain price fluctuations within two converging trend lines. Notably, the BONE price has rebounded twice from the lower trendline and thrice from the upper trendline, underscoring the pattern’s substantial impact on influencing price behavior. Here’s how the chart setup may assist in predicting near-future trends.
Also Read: BTC, ETH, BONE, and DYDX Prices Surge Ahead of Key Fed Talk
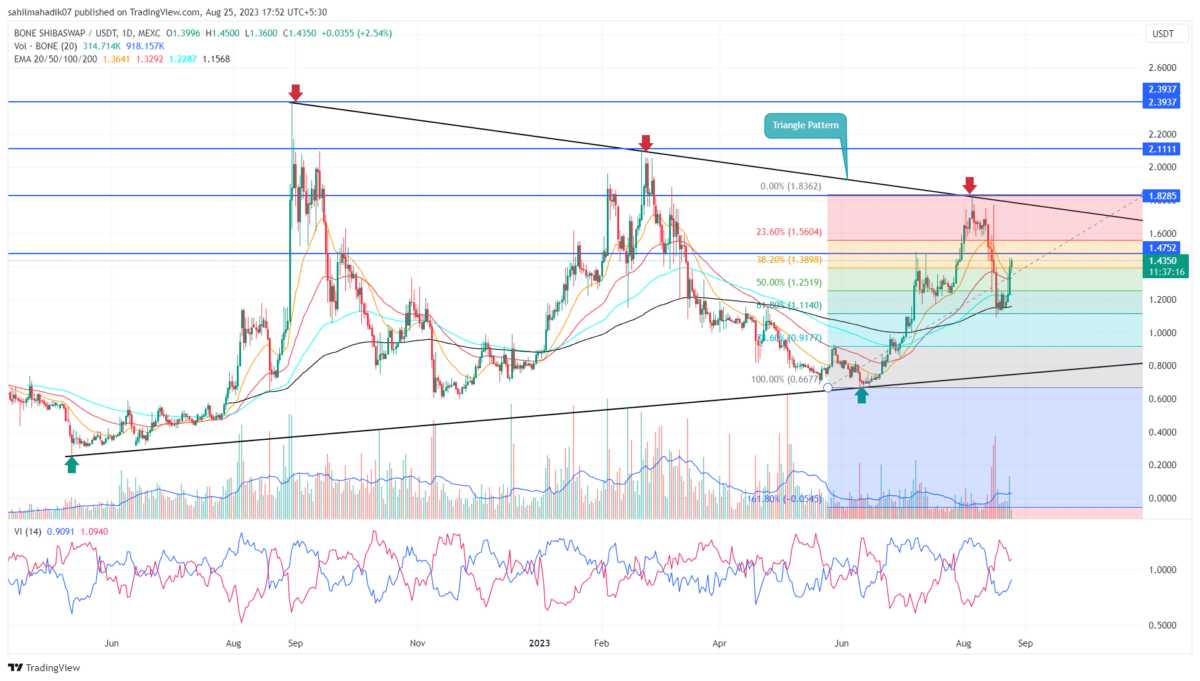
Bone Daily Chart: Key Points
- A breakout above $1.47 sets the coin price for an 18% rally.
- Until the triangle pattern is intact, the BONE ShibaSwap coin may prolong the sideways trend
- The intraday trading volume of the Bone ShibaSwap token is $22.7 Million, showing a 59% gain.
 Source- Tradingview
Amid the August month correction, the BONE price faced a downturn. Following its high of $1.82, the price experienced a sharp decline of 39%, plummeting to a low of $1.1.
In the midst of prevailing uncertainty within the broader crypto market, the BONE price found support at the 61.8% Fibonacci retracement level. This marked a pivotal turning point as the price surged by 26.5%, ultimately settling at its current valuation of $1.39.
Should the current bullish momentum persist, market participants can anticipate the possibility of breaching the overhead resistance at $1.47. A successful breakout could propel the BONE price by 18%, positioning it to challenge the upper trendline of the symmetrical triangle pattern. A successful breach of this barrier would signal a promising shift toward a new bull trend, potentially hitting the early targets of $2.1, Followed by $2.39
Will Bone Price Resume Correction Trend?
While the BONE price exhibits upward momentum, it is essential to recognize the impending resistance at the upper trendline of the symmetrical triangle pattern. The anticipated supply pressure at this juncture could potentially impede further immediate advances. Should weakness persist within the market sentiment, this memecoin could experience a bearish reversal from the dynamic resistance and trigger a new correction trend.
- Vortex Indicator: The V+(blue) and VI-(orange) slope nearing a bullish crossover reflect the increased buying momentum.
- EMAs: The 200-day EMA waving in a lateral path accentuates a sideway trend in BONE.
- Litecoin Whale Accumulation Surges, LTC Price Breakout Above $100 Imminent?
- Bitcoin Price Today: Exchange Supply Hits Low At 1.7M BTC Ahead ETF Second Wave
- Render Price Slips As Whale Offloads $3M RNDR, What’s Next?
- Cardano Founder Charles Hoskinson Backs Elon Musk Amid $55B Tesla Pay Fiasco
- Gold and Silver Hit New Record Highs, Will BTC Catch Up Soon?
- Crypto Price Analysis 20/5: Altcoins See Higher Rally As BTC Holds Strong Above $66,000
- Shiba Inu Coin Price Forecast Amid Skyrocketing Burn Rate, $0.00005 SHIB Before June?
- 5th Scape (5SCAPE) Price Prediction 2024, 2025, 2030
- Solana Price Analysis: Can SOL Surge Past $200 in the Coming Week?
- Bitcoin Price Analysis: Whale Accumulation Near Pre-FTX Levels Sets BTC Rally to $74K


