
Disclaimer: The findings of the following analysis are the sole opinions of the writer and should not be considered investment advice
alt HD: Some respite for Polkadot on the price charts, can buyers follow through in the coming weeks?
The development activity of Polkadot has steadily risen in the months of April and May, even as the price tumbled past support levels on the price charts. Bitcoin was indecisive at the $30k area as well, and both BTC and DOT have strong resistance levels to the north. Could a recovery be around the corner, and can Polkadot register strong gains in the weeks to come?
DOT- 1 Hour Chart
Source: DOT/USDT on TradingView
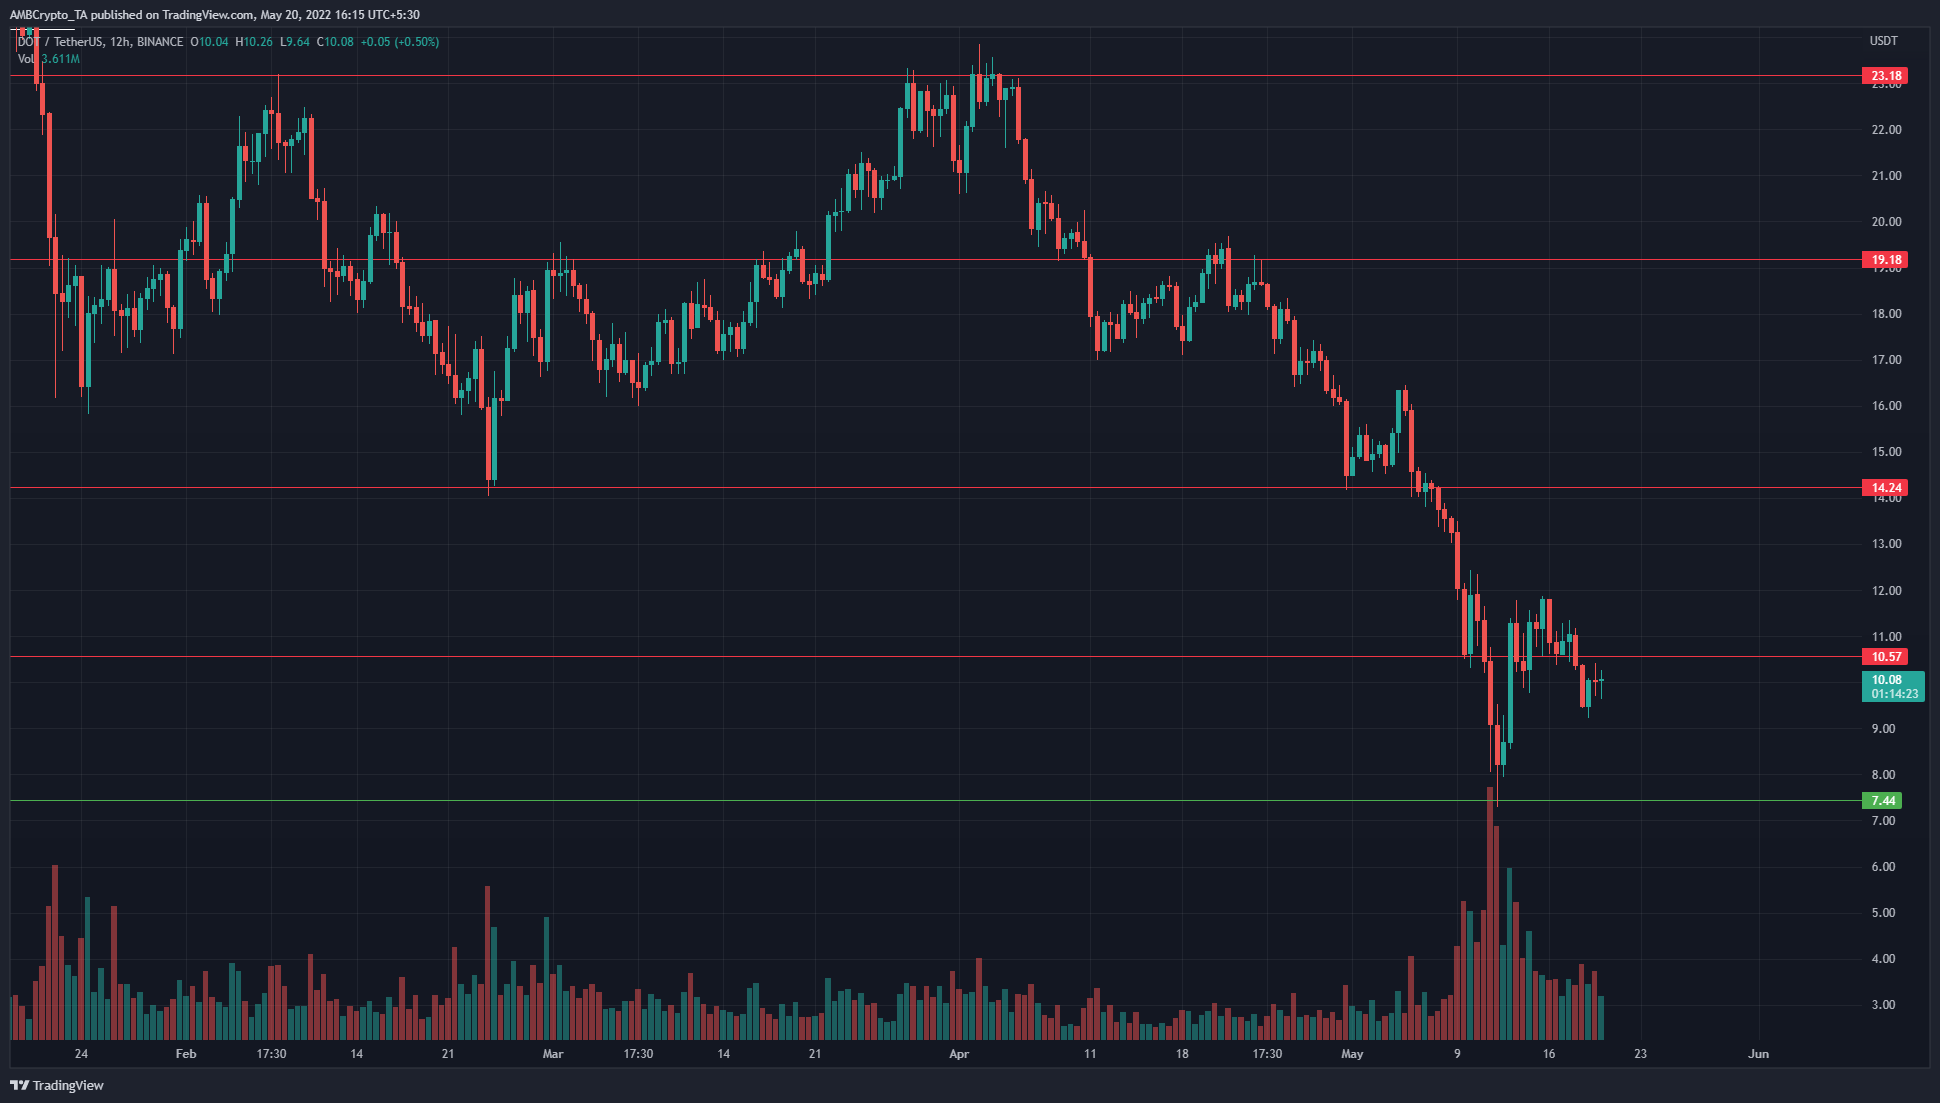
In February and March, DOT appeared to trade within a range from the $23.18 resistance level to the $14.24 support level. However, in the wave of intense selling in May, DOT dropped much lower on the charts and dipped as low as the $7.44 support. This support level had previously been tested in January 2021.
At the time of writing, the bulls and the bears were skirmishing at the $10 area, with $10.5 also being a significant horizontal level to watch. In the past couple of weeks, there has been a significant amount of trading volume as the price saw a steep fall, but bounced somewhat.
Does that mean the bottom is in for DOT? Not necessarily. The longer-term bias for DOT would remain bearish on the charts until DOT can push past the $14 level, and bulls are able to defend the $12-$14 area upon a retest.
Rationale
Source: DOT/USDT on TradingView
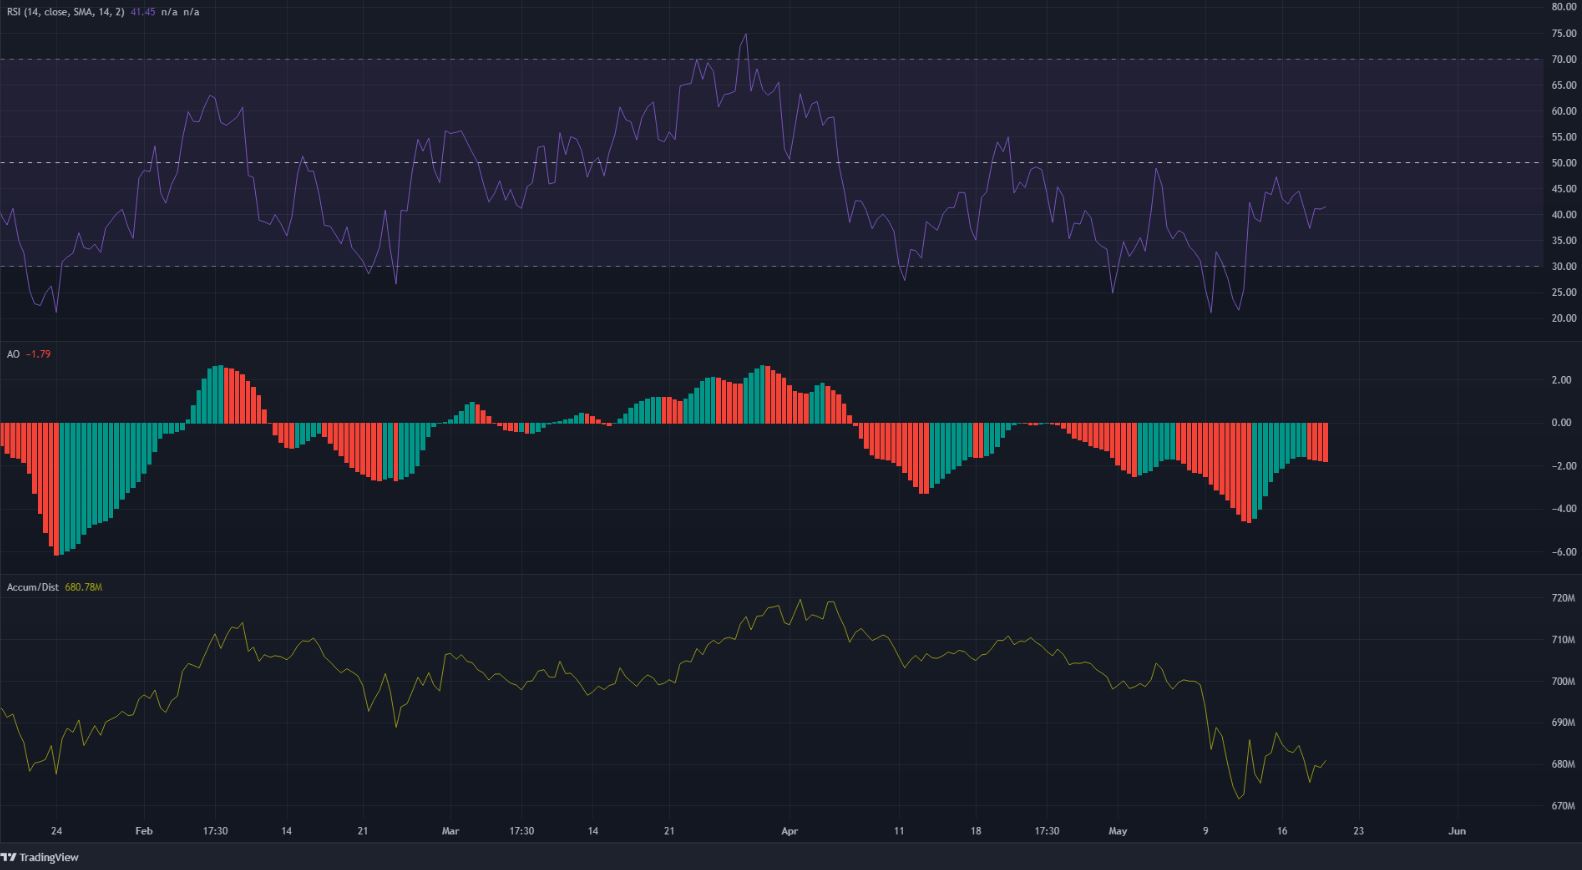
In the past two months, the RSI has been below neutral 50 for a significant amount of time, to denote a bearish trend in progress. The Awesome Oscillator was also beneath the zero line, highlighting the bearish bias.
However, the RSI was able to climb past 40, and the AO also showed weakening downward momentum in the past few days. This indicated a pullback in the downtrend and could be followed by another push southward.
The A/D has also been sliding, which meant selling has been dominant in the past month.
Conclusion
The drop beneath the $10 mark was absorbed by buyers, but the trend remains bearish. Moreover, Bitcoin also faces heavy resistance above it. Therefore, further losses could be around the corner for Polkadot. The bulls would need to reclaim the $12-$14 area before the longer-term bias can shift in their favor.