A ‘random’ news event generated a spike in Bitcoin’s price, elevating it off of a technical condition that would have signaled continued selling pressure. Support may have been established, and new trading opportunities have presented themselves.
Cardano (ADA)
 Cardano (ADA)
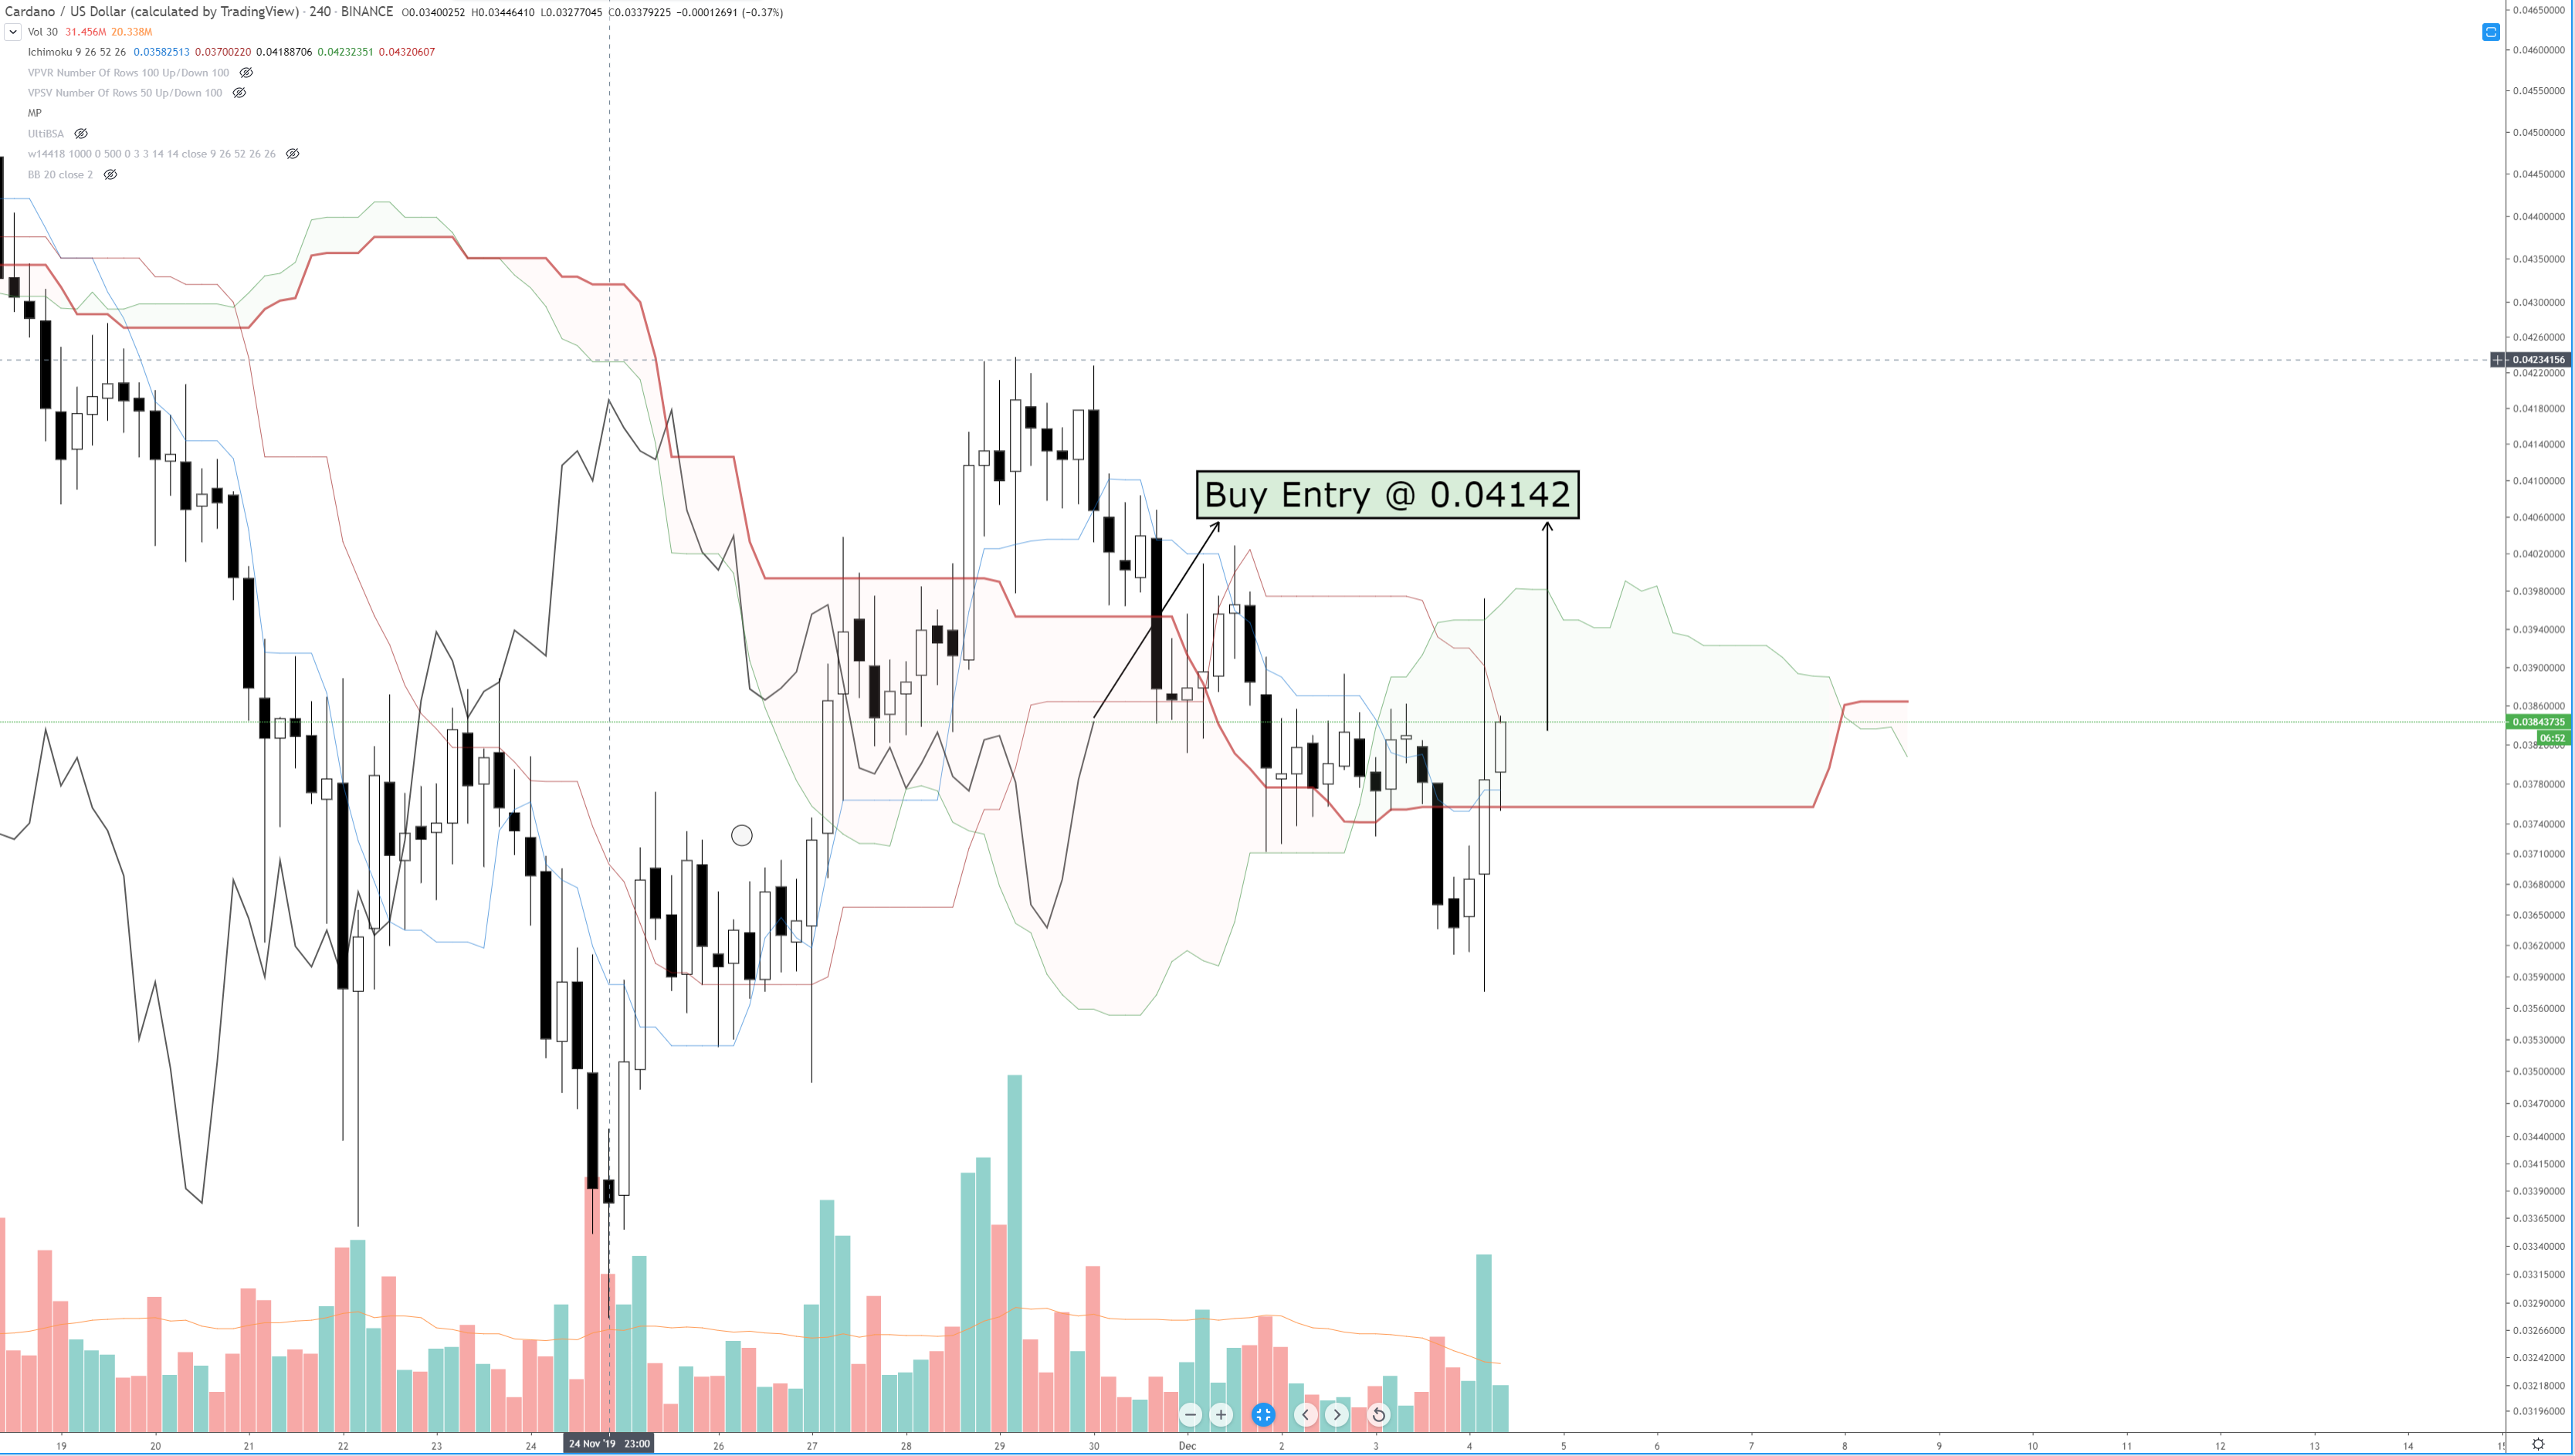
The hockey-stick save that the cryptocurrency market got from the $84 million funny-money Tether transfer to OKex generated some significant bullish speculation. And that has translated further into the rest of the cryptocurrency market. The chart above is Cardano’s 4-hour Ichimoku chart. With Cardano able to close the 4-hour candle inside the Cloud, we could see some strong returns higher. Entry at $0.04142 would yield put Cardano into a primary bullish continuation setup: Chikou Span above the candlesticks and in open space and price above the Cloud.
Buy Signal @ $0.04142
Ethereum (ETH)
 Ethereum (ETH)
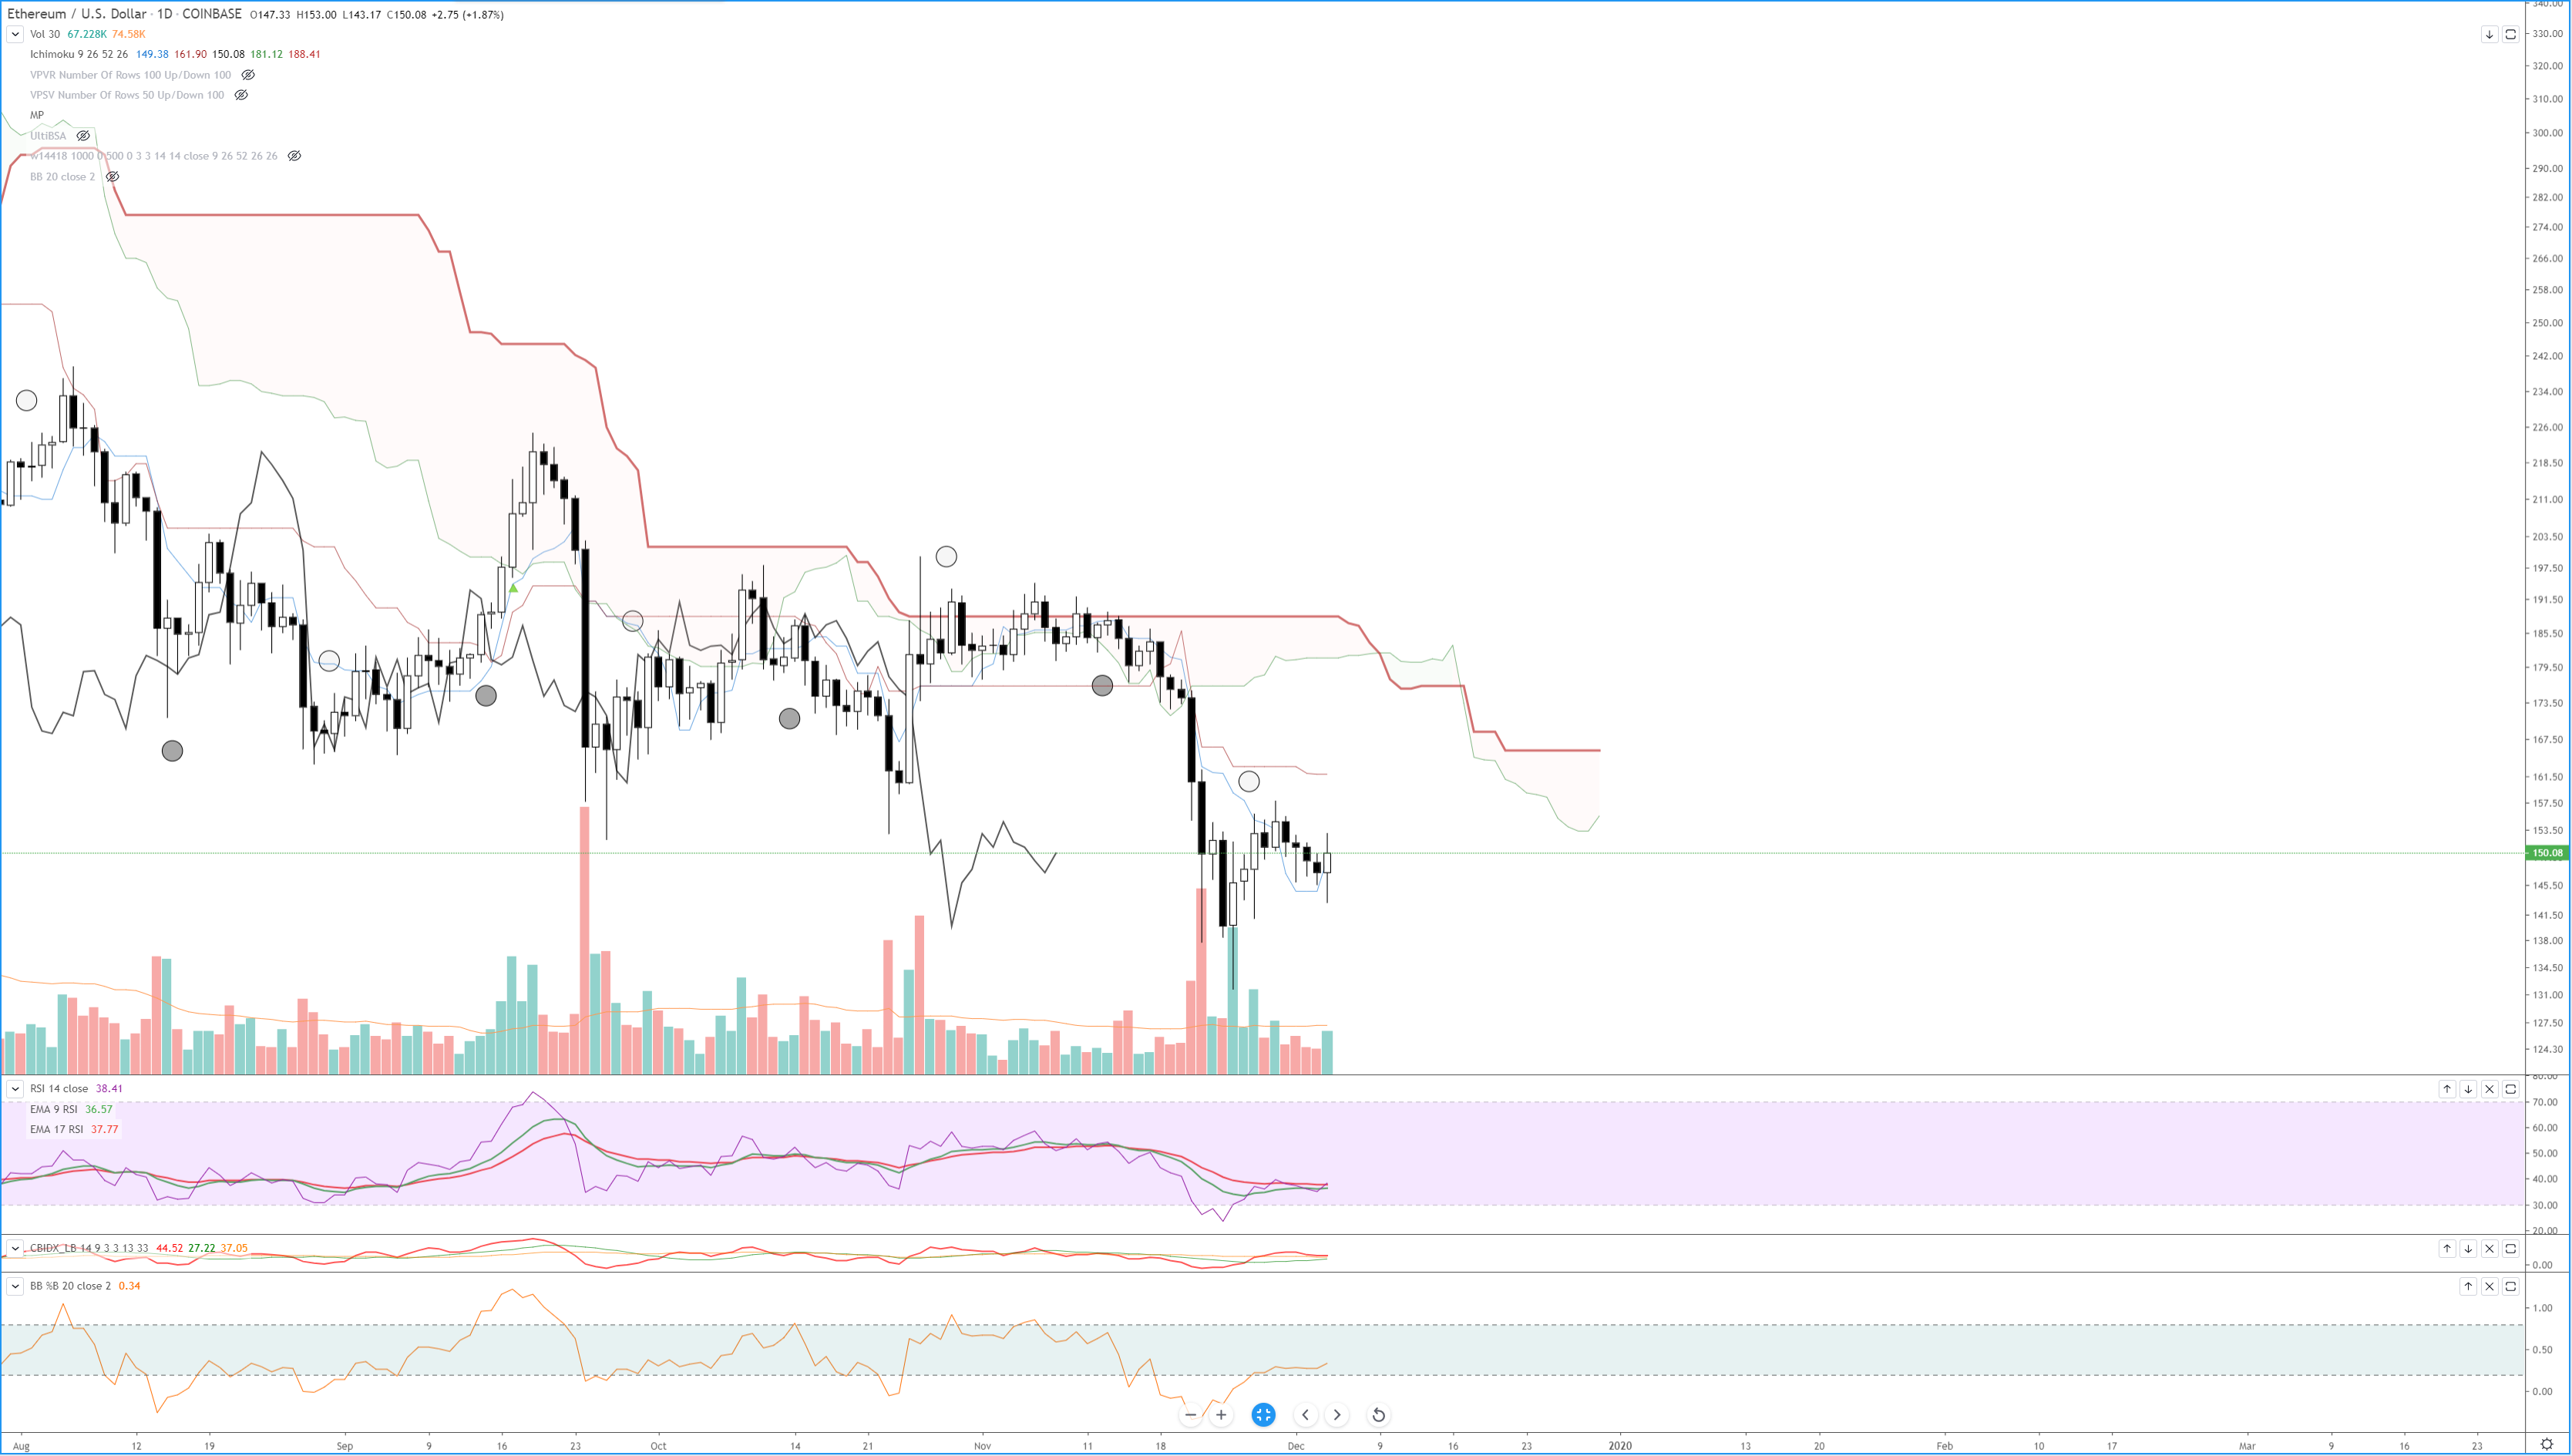
Ethereum (ETH) almost experienced a bearish continuation trade setup. Unless something changes between now (1500 EST) and the close of the daily candlestick at 1900, Ethereum will maintain a bullish condition by remaining above the daily Tenkan-Sen. The current daily candlestick is a very, very bullish one: a bullish engulfing candlestick. This daily candle doesn’t just engulf yesterday's trading range, and it also engulfs Monday’s and Sunday’s price ranges. Adding to this condition is the daily volume; today’s volume is the most substantial daily volume in five days. The RSI is crossing above both of its averages, and the %B has bounced off the 0.2 level pointing higher. A risky entry would be above the high of today, or, another aggressive entry could be entered when price closes above the Kijun-Sen. The most conservative entry would occur when price and the Chikou Span move above the Cloud.
Very aggressive buy signal @ $153.01
Less aggressive buy signal @ $163.14
Conservative buy signal @ $189.40.
NEM (XEM)
 NEM (XEM)
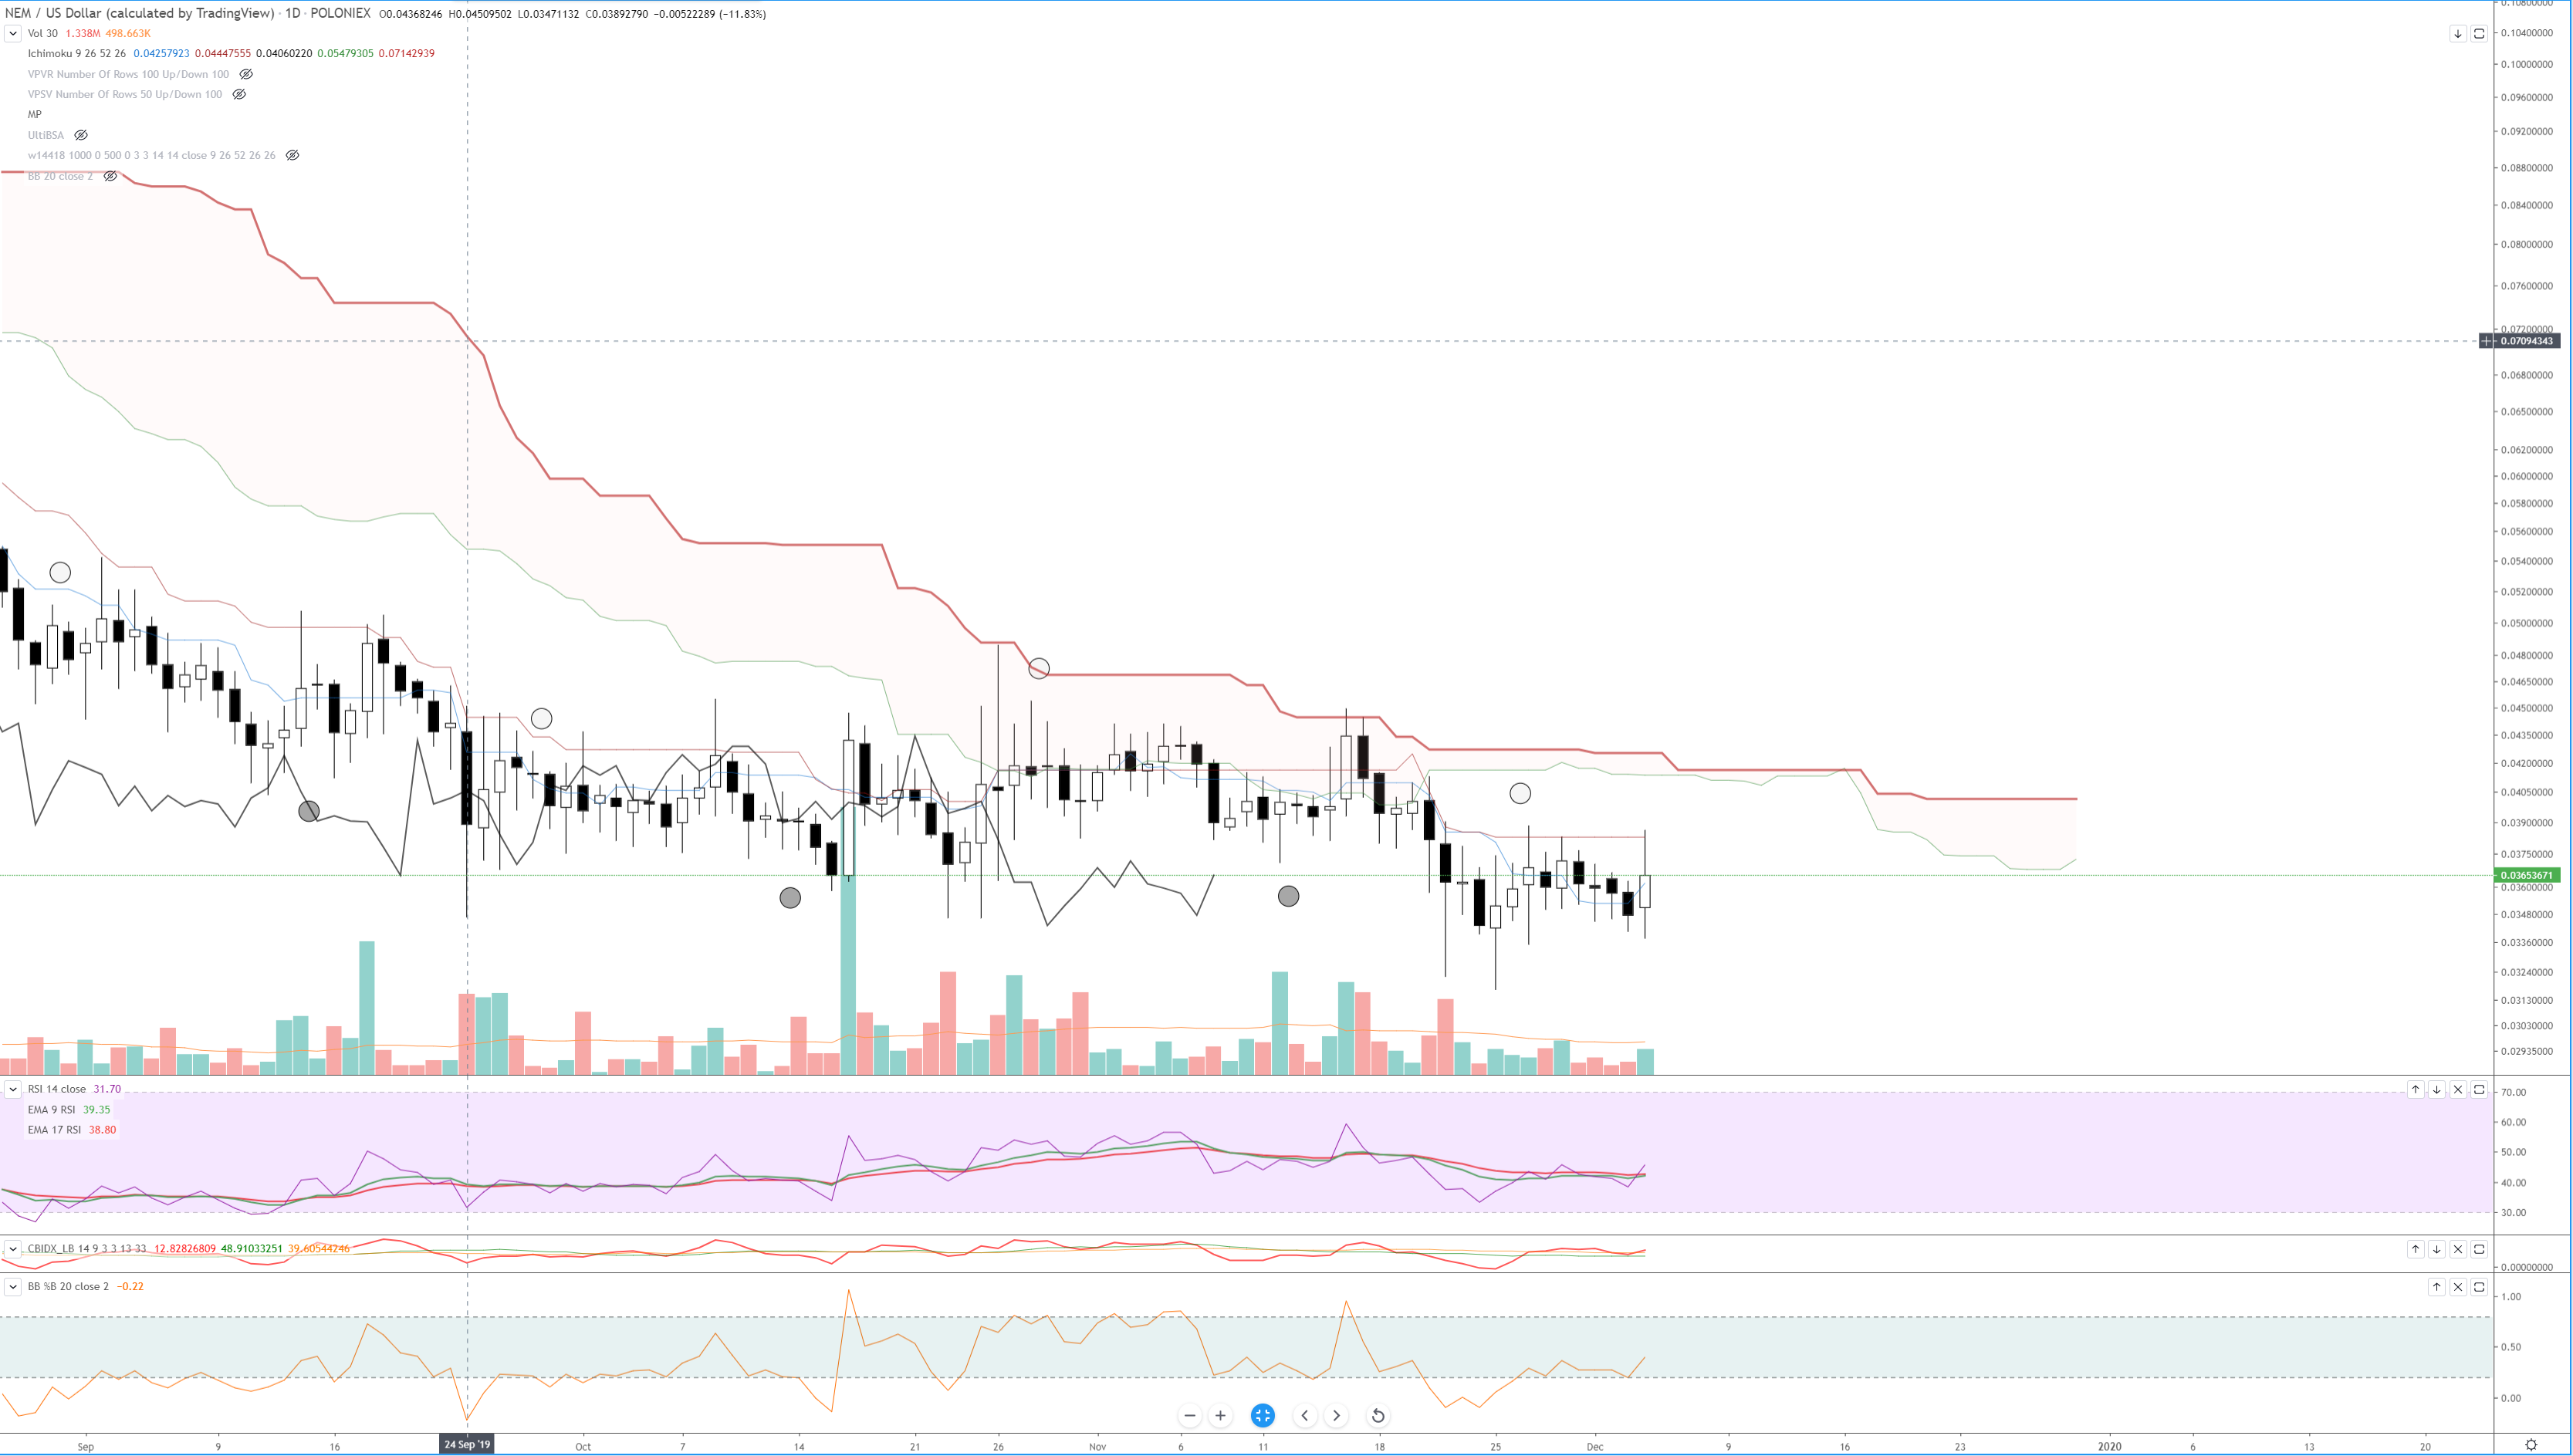
NEM has a similar chart setup to Ethereum’s. NEM has its bullish engulfing candlestick with higher volume, but NEM’s daily candlestick is engulfing the price range of the past six days. NEM also has the RSI crossing above its averages and the Composite Index crossing above its slow and fast averages. The entry on NEM is a fairly straight forward one and one that is on par with the rest of the signals we’ve discussed: price and the Chikou Span moving above the Cloud. For NEM, that would occur at roughly $0.04466. No
Buy Signal @ $0.04466
EOS (EOS)
 EOS (EOS)
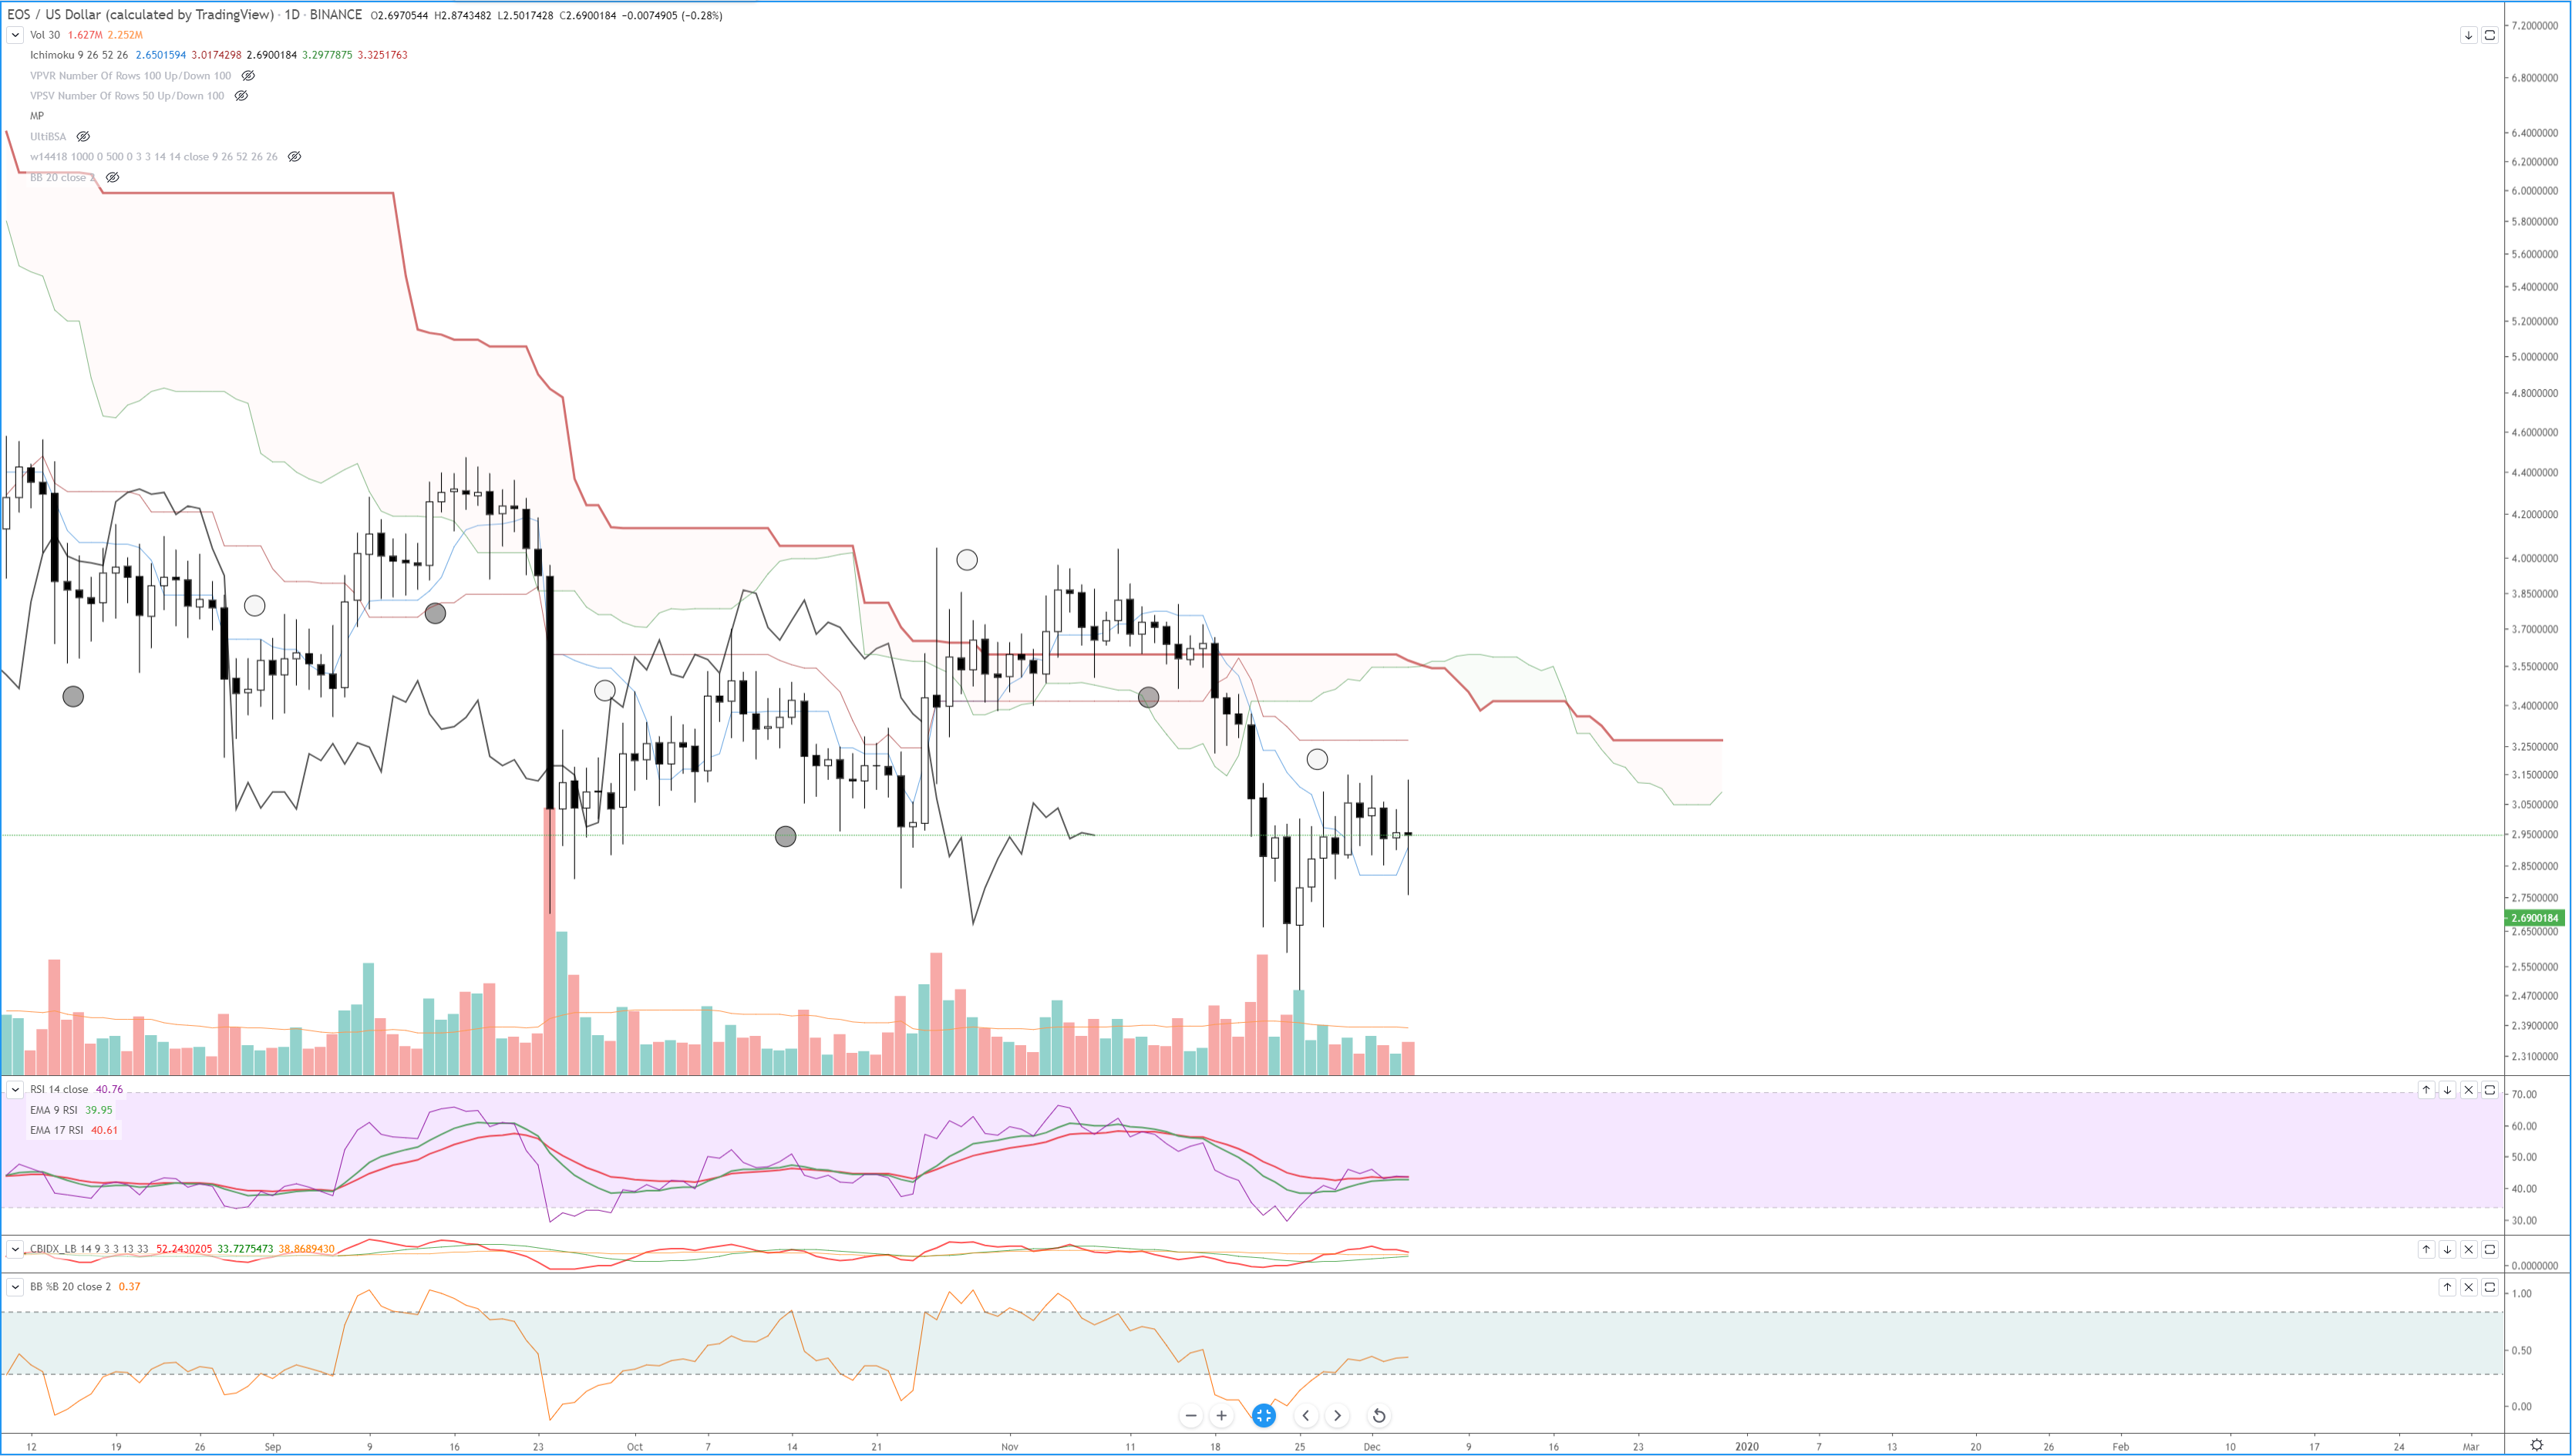
I’m not a huge fan of EOS. It’s decentralized, like the oil industry is decentralized. EOS has been under some tremendous selling pressure throughout 2019, creating new 6-month lows as recently as November 24th. The current daily candlestick has been shifting like Christmas tree lights changing from green to red for the better part of 6 hours. The candlestick is indecisive. I am looking for an aggressive entry above the current day’s high. But I would keep a tight leash on any long trade, the daily RSI and Composite Index do not look favorable for any continued long trade setup. This may be avoided if the aggregate market starts to drive higher.
Buy Signal @ $2.9022
See live prices and historical data on all the cryptocurrencies we track. Quick links to bitcoin, ethereum and litecoin.