
Disclaimer: The findings of the following analysis are the sole opinions of the writer and should not be considered investment advice.
The last three months have seen Zilliqa [ZIL] descend below some key price points while propelling a bearish flip on the EMA ribbons.
The market structure recently saw buying resurgence in the $0.031-zone that helped ZIL find a close above the three-month trendline support (white, dashed). This rebound would likely face hurdles in the $0.042 and $0.05 range while the Fibonacci resistances stood sturdy.
At press time, ZIL was trading at $0.04002, down by 6.05% in the last 24 hours.
ZIL Daily Chart

Source: TradingView, ZIL/USDT
Since matching its yearly highs in the $0.18-zone, ZIL has been on an aggressive downslide. The alt lost over 87% of its value from 1 April and plunged towards its 18-month low on 18 June.
After the EMA ribbon undertook a bearish flip, the 20 EMA (dark yellow) has been curbing most buying rallies. The sellers visibly exhibited their edge in the current market dynamics.
The recent rebound from the $0.03-level aided ZIL to flip the three-month trendline resistance to support. But the 38.2% Fibonacci level coincided with the EMA ribbons to create a robust barrier for buying rallies.
From a relatively conservative lens, a convincing reversal from the 38.2% level could lead ZIL into a tight phase in the $0.037-$0.042 range. Any potential close below the trendline support could lead to a retest of the $0.03 long-term support.
Any improvements in the broader sentiment could help ZIL invalidate the bearish tendencies and test the 61.8% level before possibly falling back into its bearish track.
Rationale
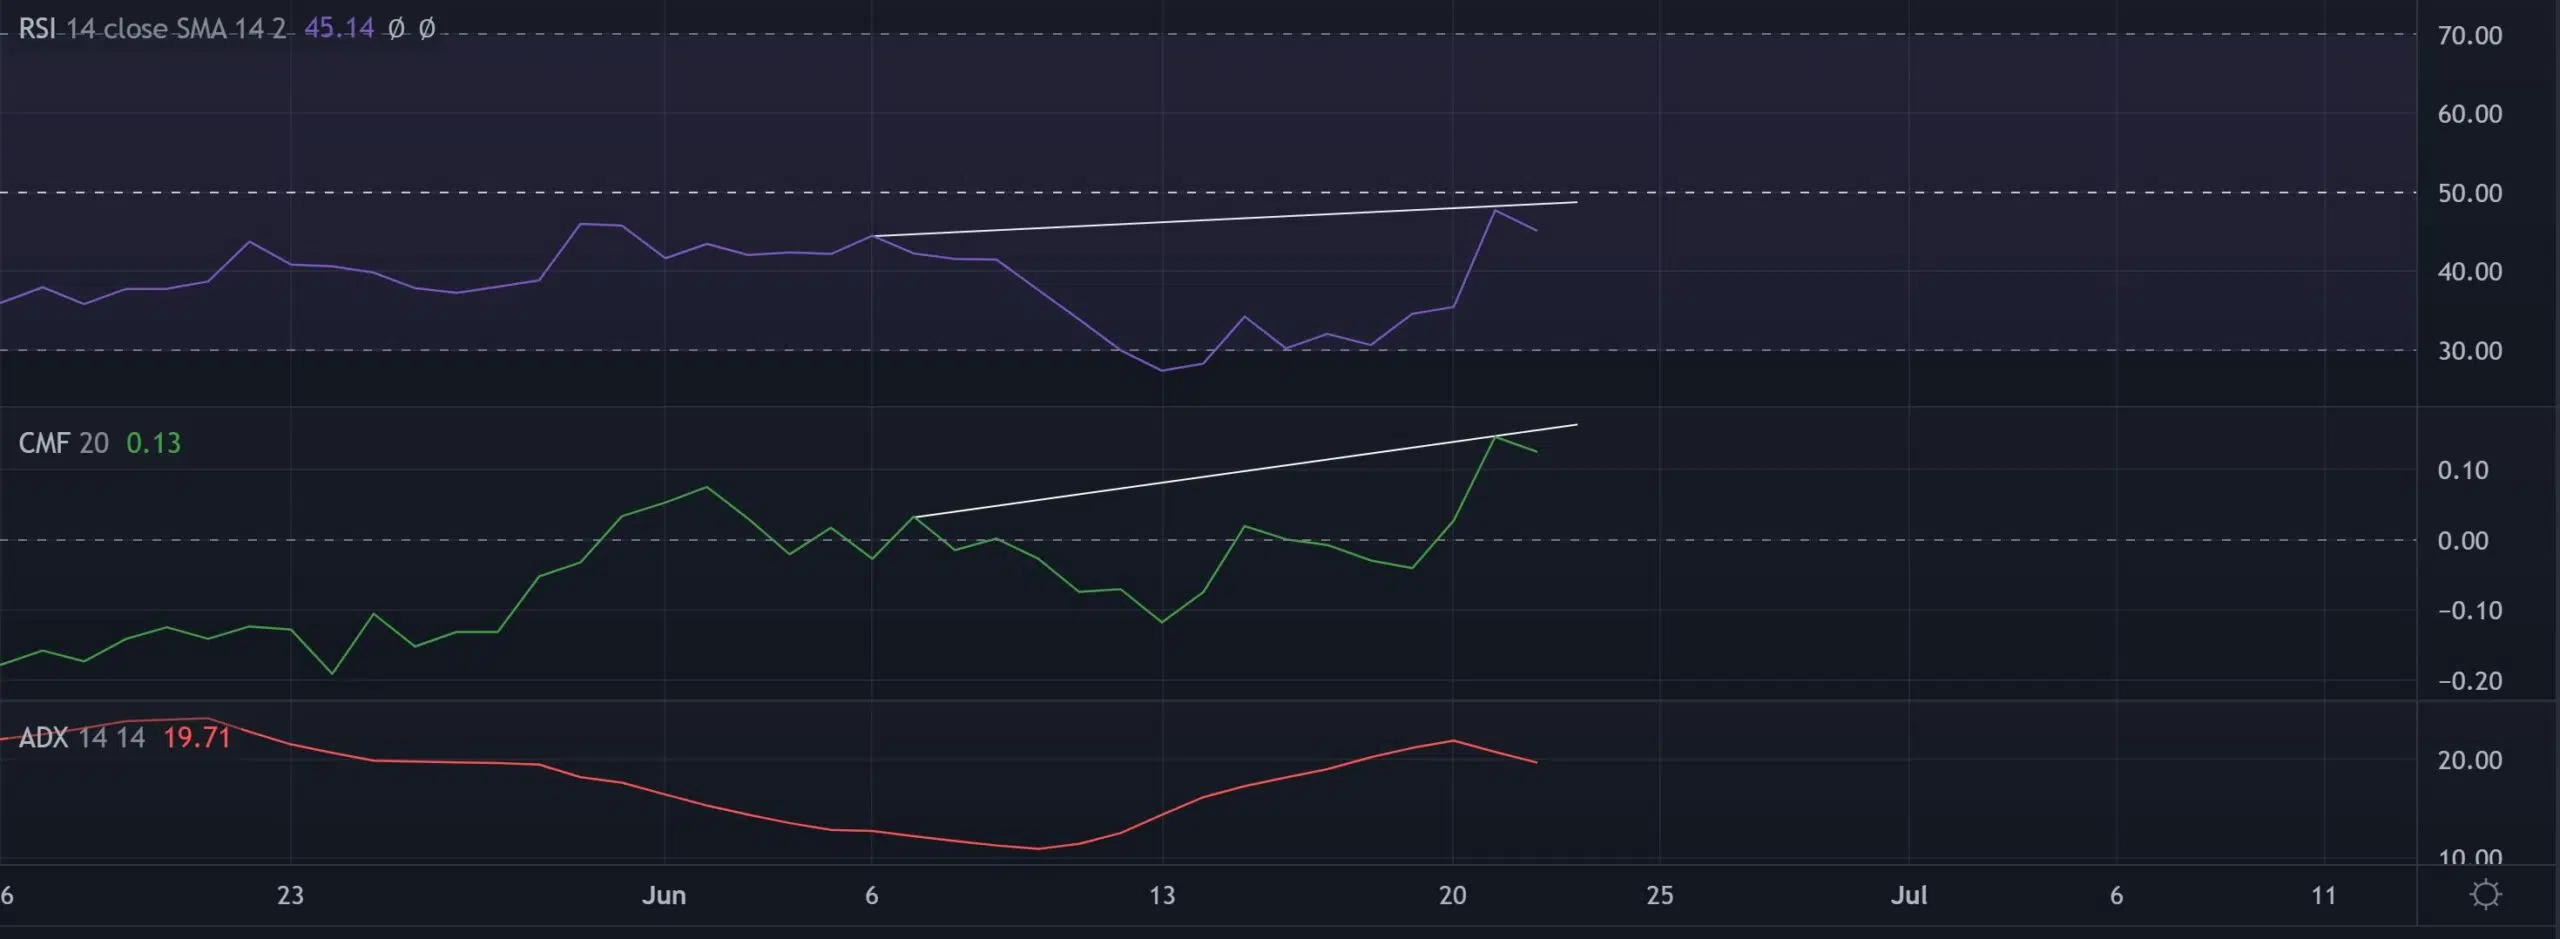
Source: TradingView, ZIL/USDT
The RSI finally revived after exiting its low volatility position near the oversold region. But its recent peaks have bearishly diverged with the price action.
Similarly, the CMF also revealed a bearish divergence after a recent reversal from its trendline resistance. Nevertheless, the ADX displayed a relatively weak directional trend for the alt.
Conclusion
ZIL’s EMA ribbons and the 38.2% level coincided to form a stiff resistance. Also, it saw bearish divergences with the CMF and RSI. Thus, it could continue to see its sluggish phase in the coming sessions. Targets would remain the same as discussed above.
Finally, investors/traders must keep a close watch on Bitcoin’s movement affecting the overall perception of the market.