Disclaimer: The information presented does not constitute financial, investment, trading, or other types of advice and is solely the writer’s opinion.
- TRX suffered crucial retracement at a key price level.
- The futures market reacted negatively to retracement with a sharp drop in Open Interest.
Bitcoin’s [BTC] bearish outlook has reverberated across the crypto market. Despite Tron’s [TRX] upward trend, the market’s bearish outlook caught up with the altcoin on its advance to a critical price level.
Read Tron’s [TRX] Price Prediction 2023-24
Tron experienced a significant retracement on its retest of the 2022 high of $0.0944 on 22 July. This highlighted the selling pressure still present at the price zone. With the retracement taking TRX toward a critical support level, will bears extend the selling pressure, or can bulls mount a fight back?
Has Tron’s bullish streak ended?

Source: TRX/USDT on Trading View
A look at TRX’s price chart on the 12-hour timeframe highlighted its recent bullish trend. Tron made a series of higher lows, flipping the $0.0711 and $0.0787 resistance levels to support.
However, the bullish trend hit a critical roadblock at the $0.0850 – $0.0940 price level. A 15% price drop between 22 July to 24 July saw Tron hovering just above a key support level, as of press time.
With the price lying at a critical level, a break below the $0.0787 support level will see bears break a confluence of support levels and a higher low. Take profit levels would lie at $0.0700 – $0.0711. This could flip TRX bearish on the higher timeframes. On the flip side, a successful defense at the support level by the bulls would sustain the uptrend for TRX.
Meanwhile, the Relative Strength Index (RSI) dipped below the neutral-50 and the Chaikin Money Flow (CMF) entered negative territory, highlighting waning demand and strong capital outflows.
Decline in Open Interest showed weakening long positions
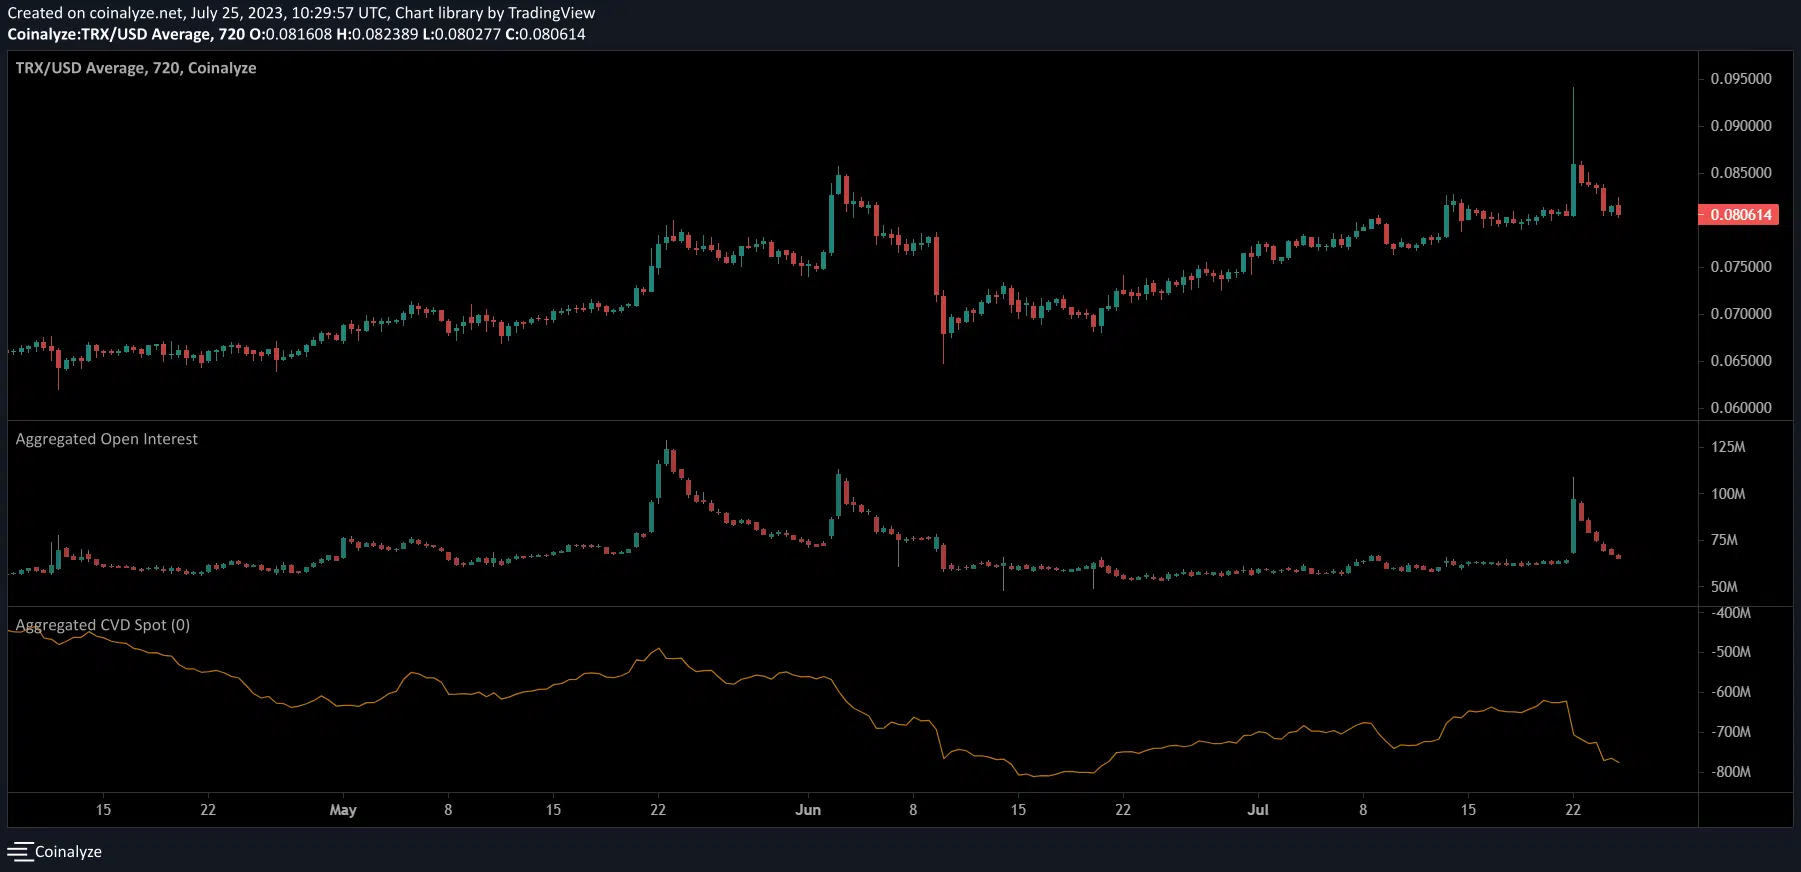
Source: Coinalyze
TRX’s price dip saw an attendant decline in its Open Interest (OI). Data from Coinalyze showed that the OI dropped from $95 million to $65 million over the past three days. This indicated liquidation by discouraged long traders which hinted at a continuation of the bearish trend for Tron.
How much are 1,10,100 TRXs worth today?
Similarly, the Spot CVD dropped sharply highlighting the waning demand. This could serve as a cue for more bearish momentum in the short term.