The price of VET continues to plummet despite the many ecosystem upgrades to the veChainThor blockchain. On 28 June, the VEchain Foundation announced its partnership with Supply@ME Capital PLC, the fintech company behind the inventory monetization platform.
According to the announcement, the alliance between the entities aims to build a first-of-its-kind “Web3 Inventory Monetisation System that utilizes blockchain, stablecoin, and NFT technology to help creditworthy businesses raise value from their inventories and provide companies with entirely new kinds of economic services.”
Trading at its December 2020 lows, the road to recovery might be long for the VET coin. Let’s take a closer look at performance since the beginning of the year.
VET may need an inter’VET’ion
The VET token commenced the year at a high of $0.083. As the rest of the cryptocurrency market struggled with the significant bearish bias that has plagued the year so far, this altcoin didn’t fare any better.
From January till the time of writing, its price went down by 72%. This token exchanged hands at $0.02306 at the time of writing. Within the same window period, the market capitalization saw a decline from the high of $5.33 billion it saw on 1 January to $1.62 billion by press time.
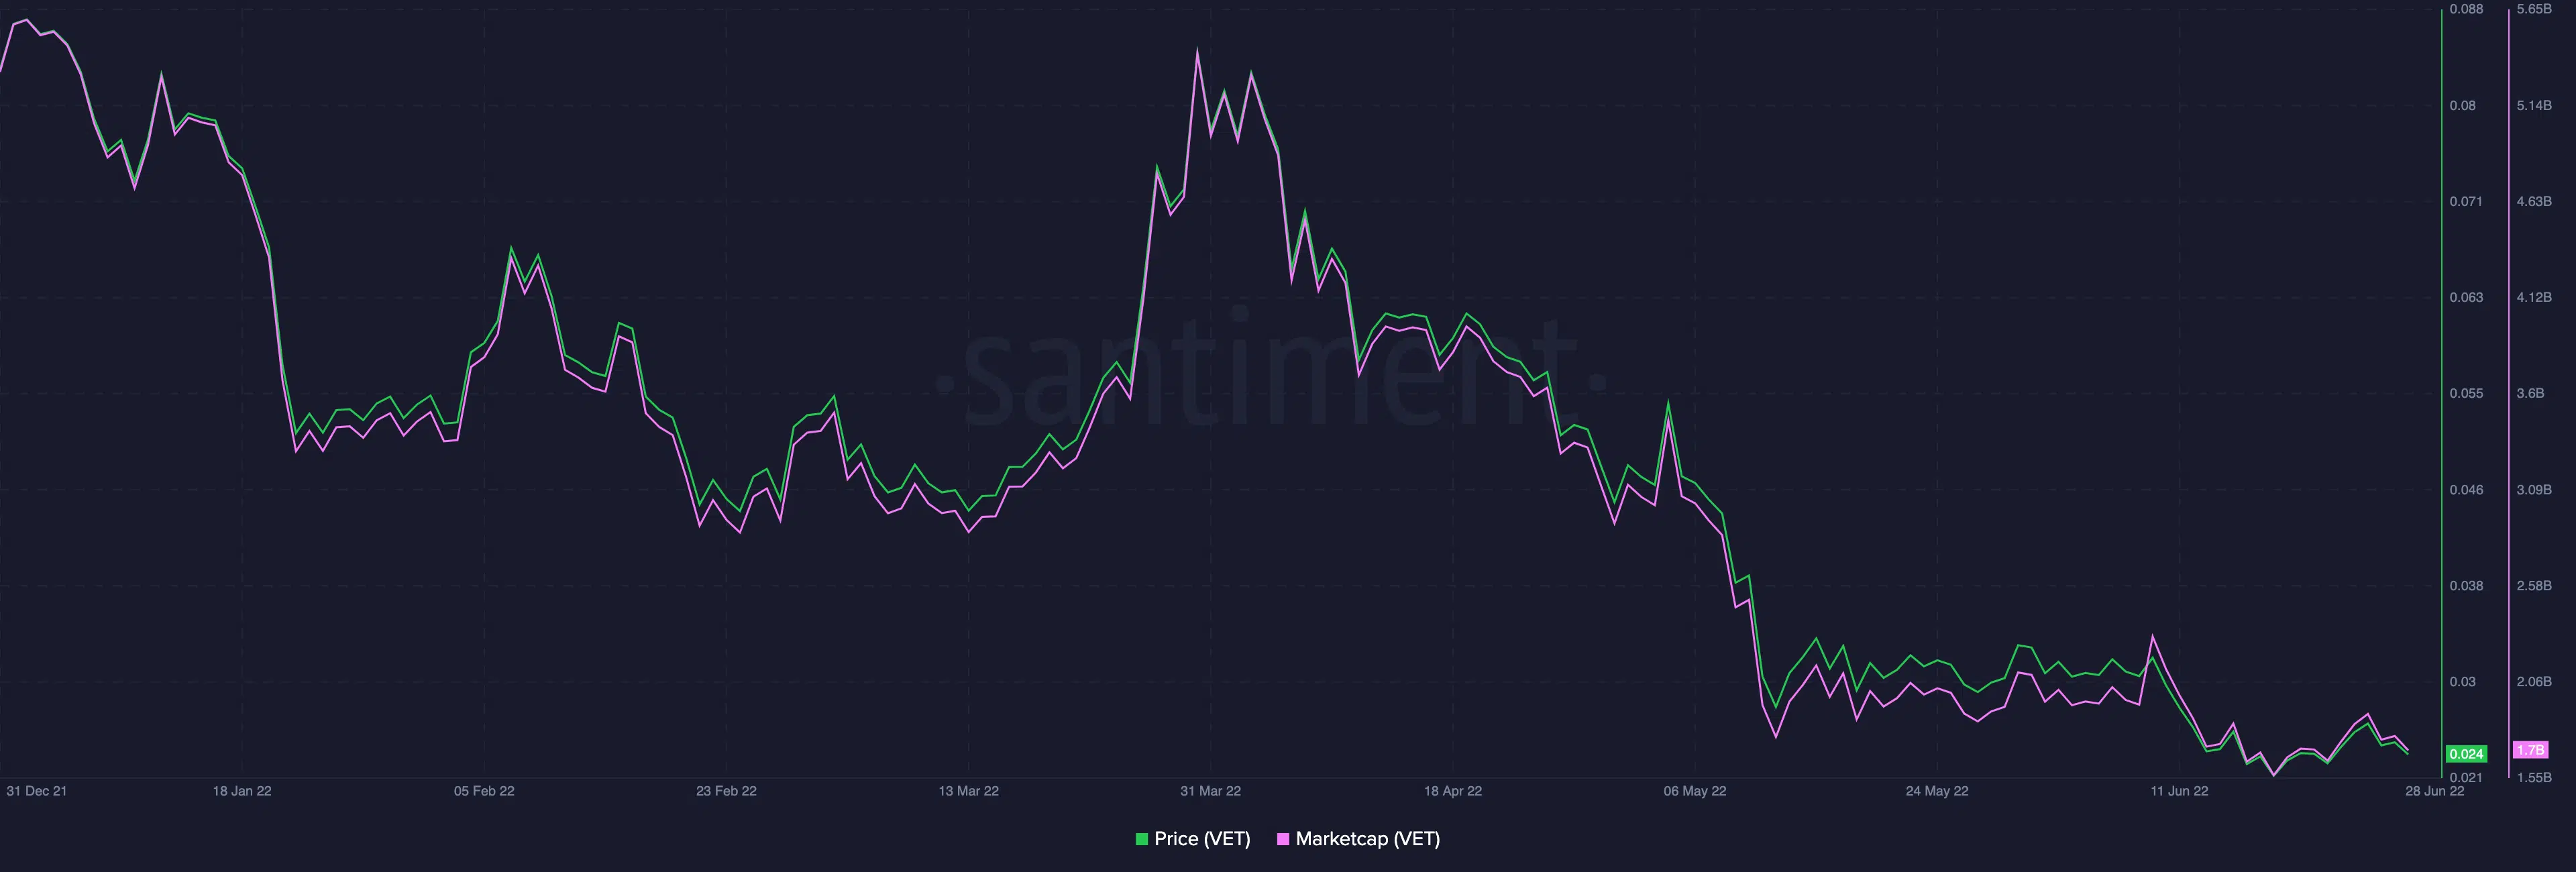
Source: Santiment
According to data from CoinMarketCap, in the last 24 hours, the VET posted 7% losses. At press time, trading volume recorded a 1% growth.
With increased selling pressure at the time of writing, the Relative Strength (RSI) of the VET was spotted in a downward curve at 39.
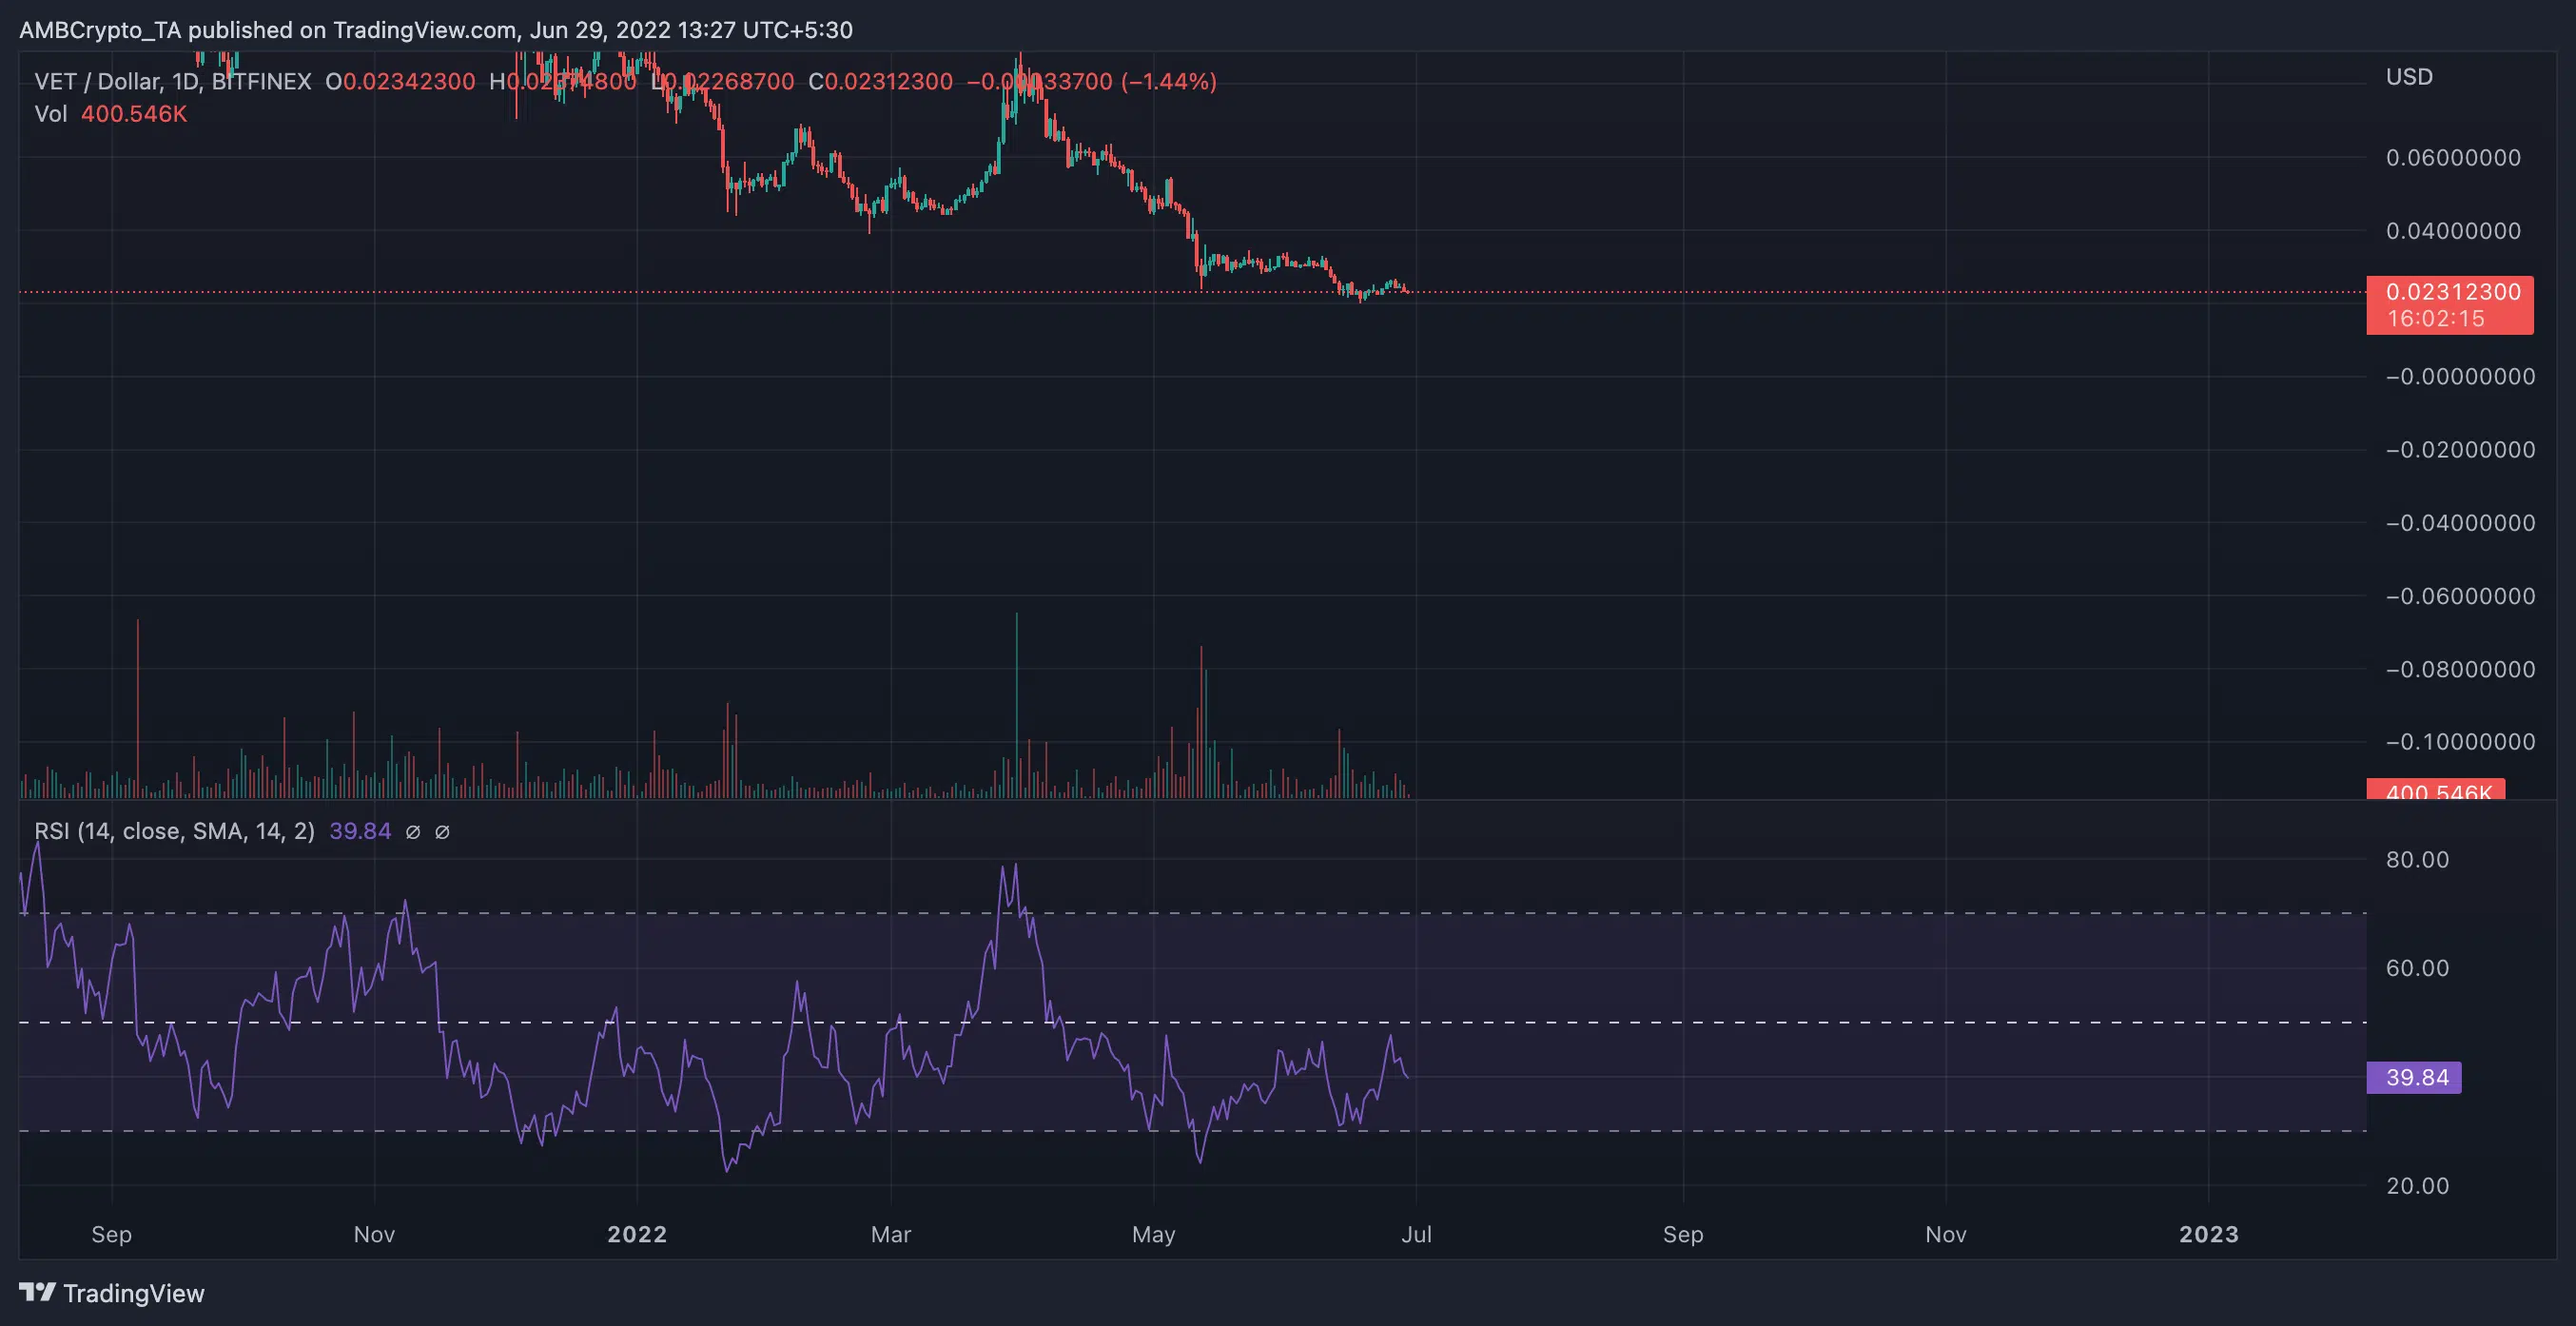
Source: TradingView
VET may need something more…
On-chain analysis of the VET token revealed that a little more than strategic partnerships might be required to revive the same. For example, on a social front, social dominance and social volume logged very low figures since the beginning of the year.
Social dominance started the year at an index of 0.41% to touch a low of 0.066% by 24 March. By 27 March, the metric saw a high of 0.62%. This was followed by several weeks of decline.
On the other hand, social dominance lodged a high of 0.66% by 9 June. Since then, it has taken on a steady decline. The social volume toed a similar path registering highs of 637 and 463 on 27 March and 9 June, respectively.
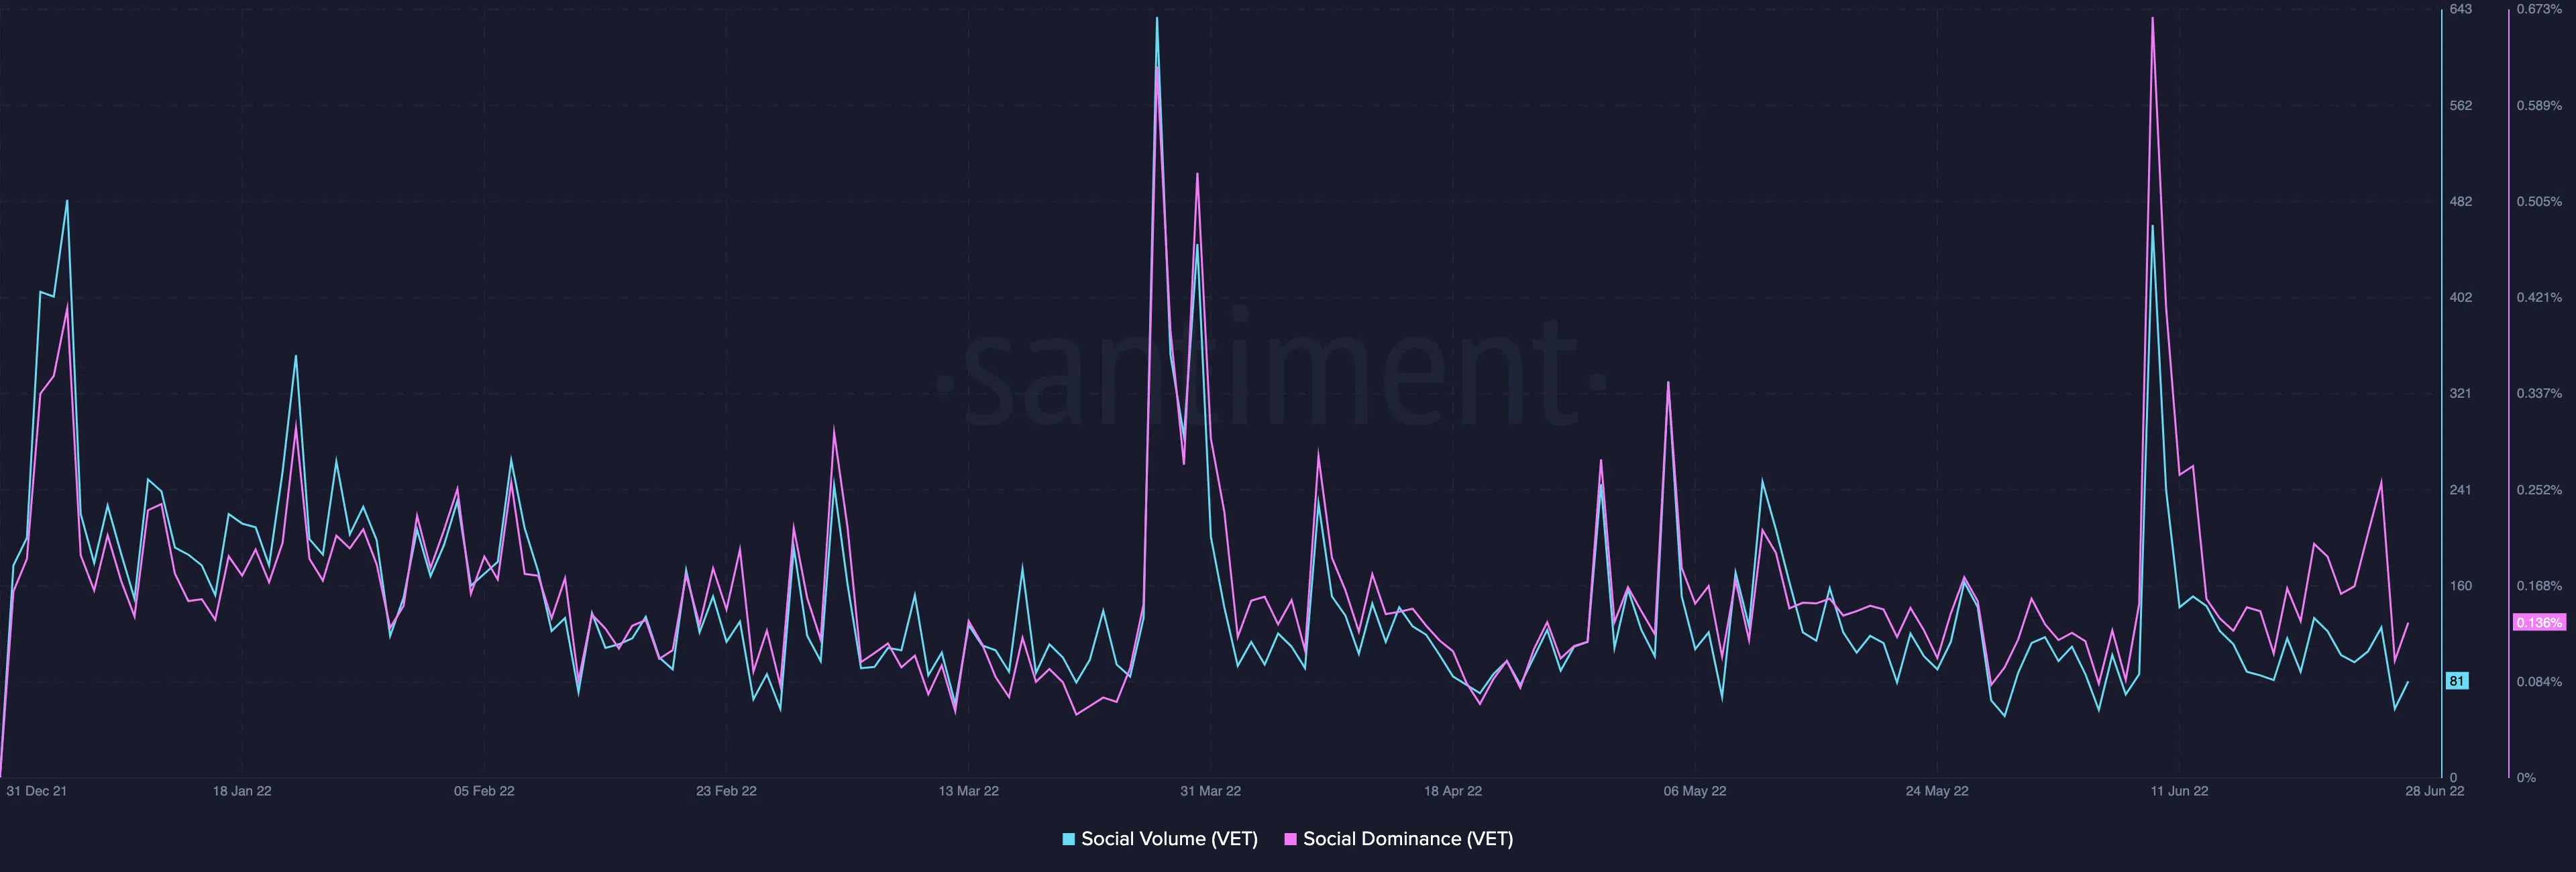
Source: Santiment
Developmental activity on the network has fared slightly better. After reaching a low of 4.38 on 4 May, it has since been on a steady growth. At press time, this stood at 7.98.
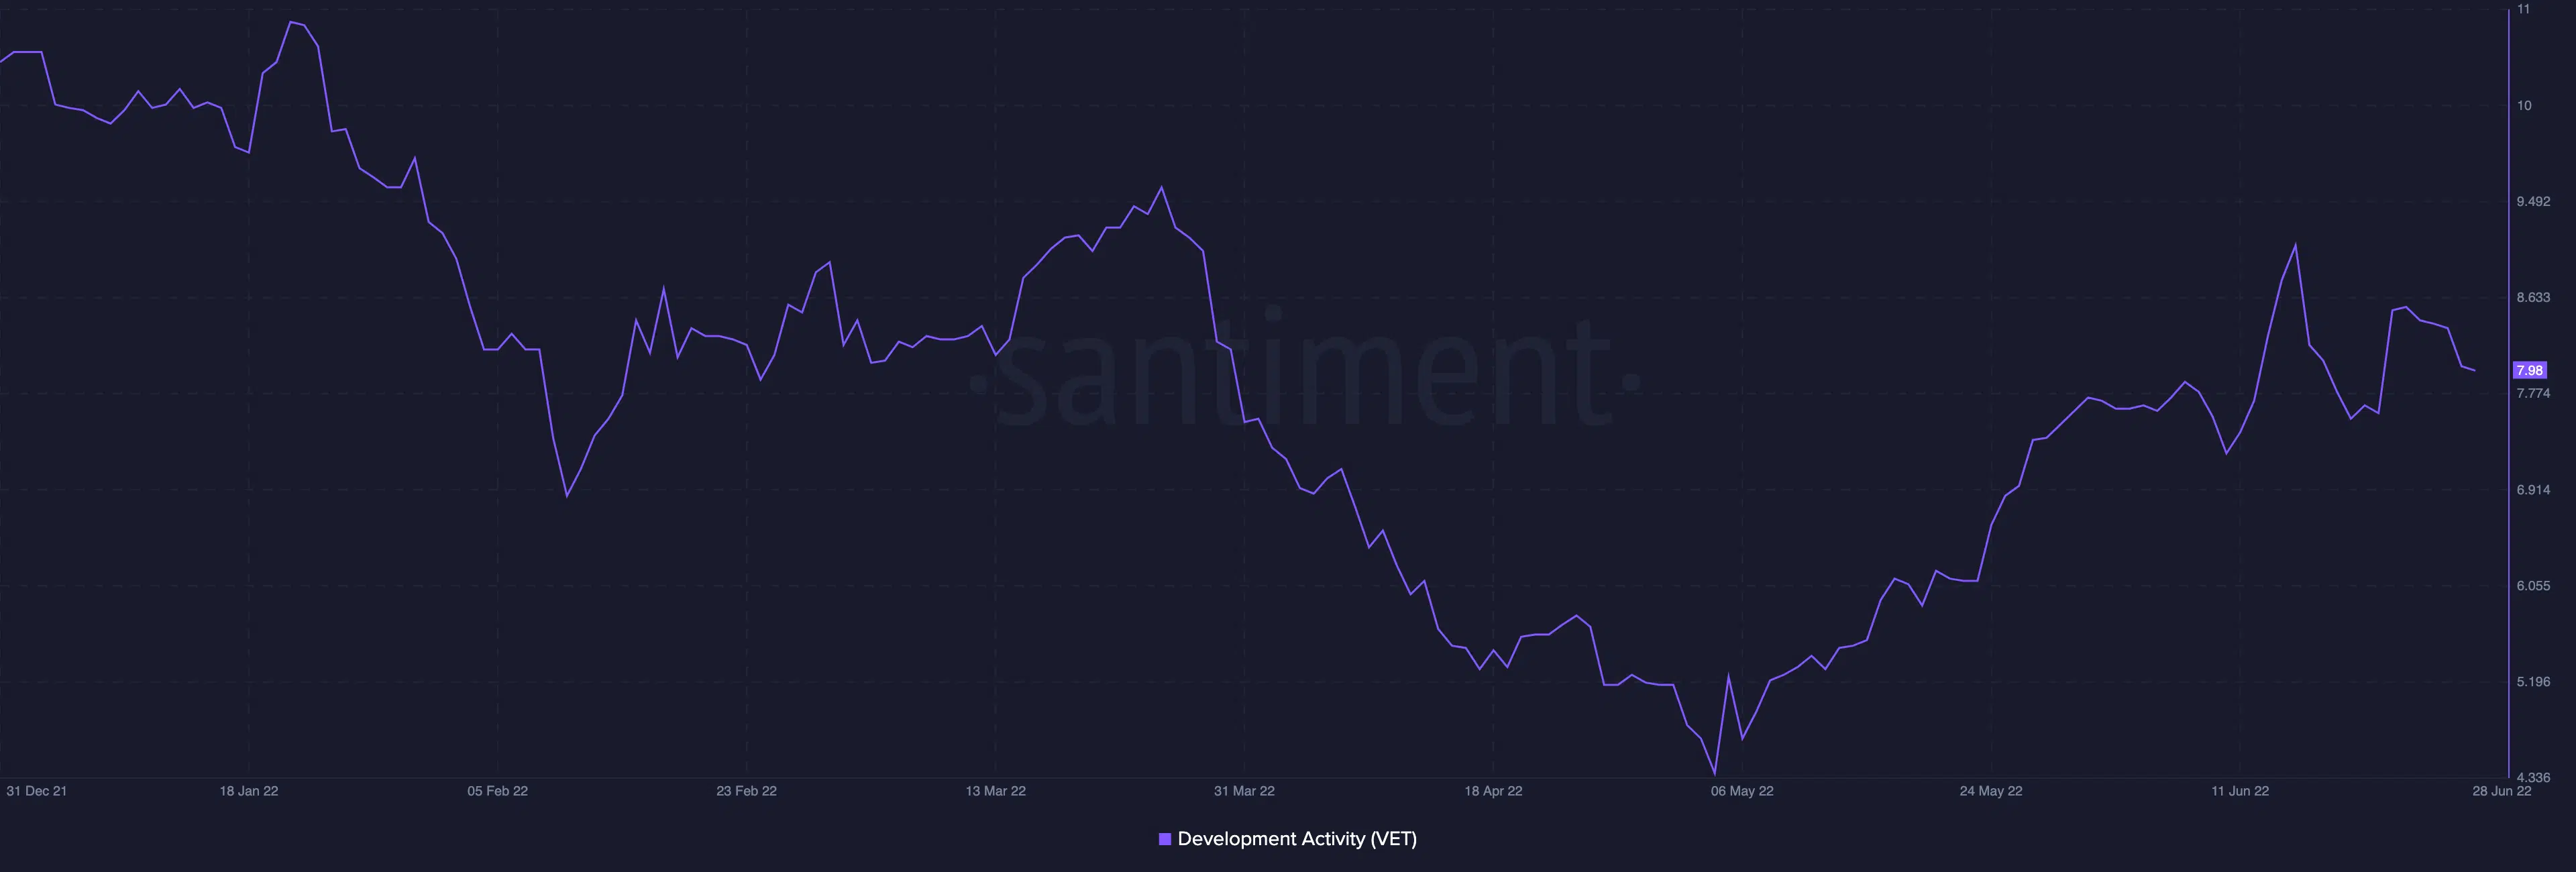
Source: Santiment

![Why Chainlink [LINK] and Polygon [MATIC] are more similar than you realise](https://ambcrypto.com/wp-content/uploads/2024/04/Chainlink_and_Polygon-1-400x240.webp)