
Solana and IOTA did not show a great amount of trading volume in the past couple of days, and at the time of writing did not present a buying opportunity yet. However, their trends appeared bullish. Convex Finance also looked strongly bullish on the charts.
Solana (SOL)
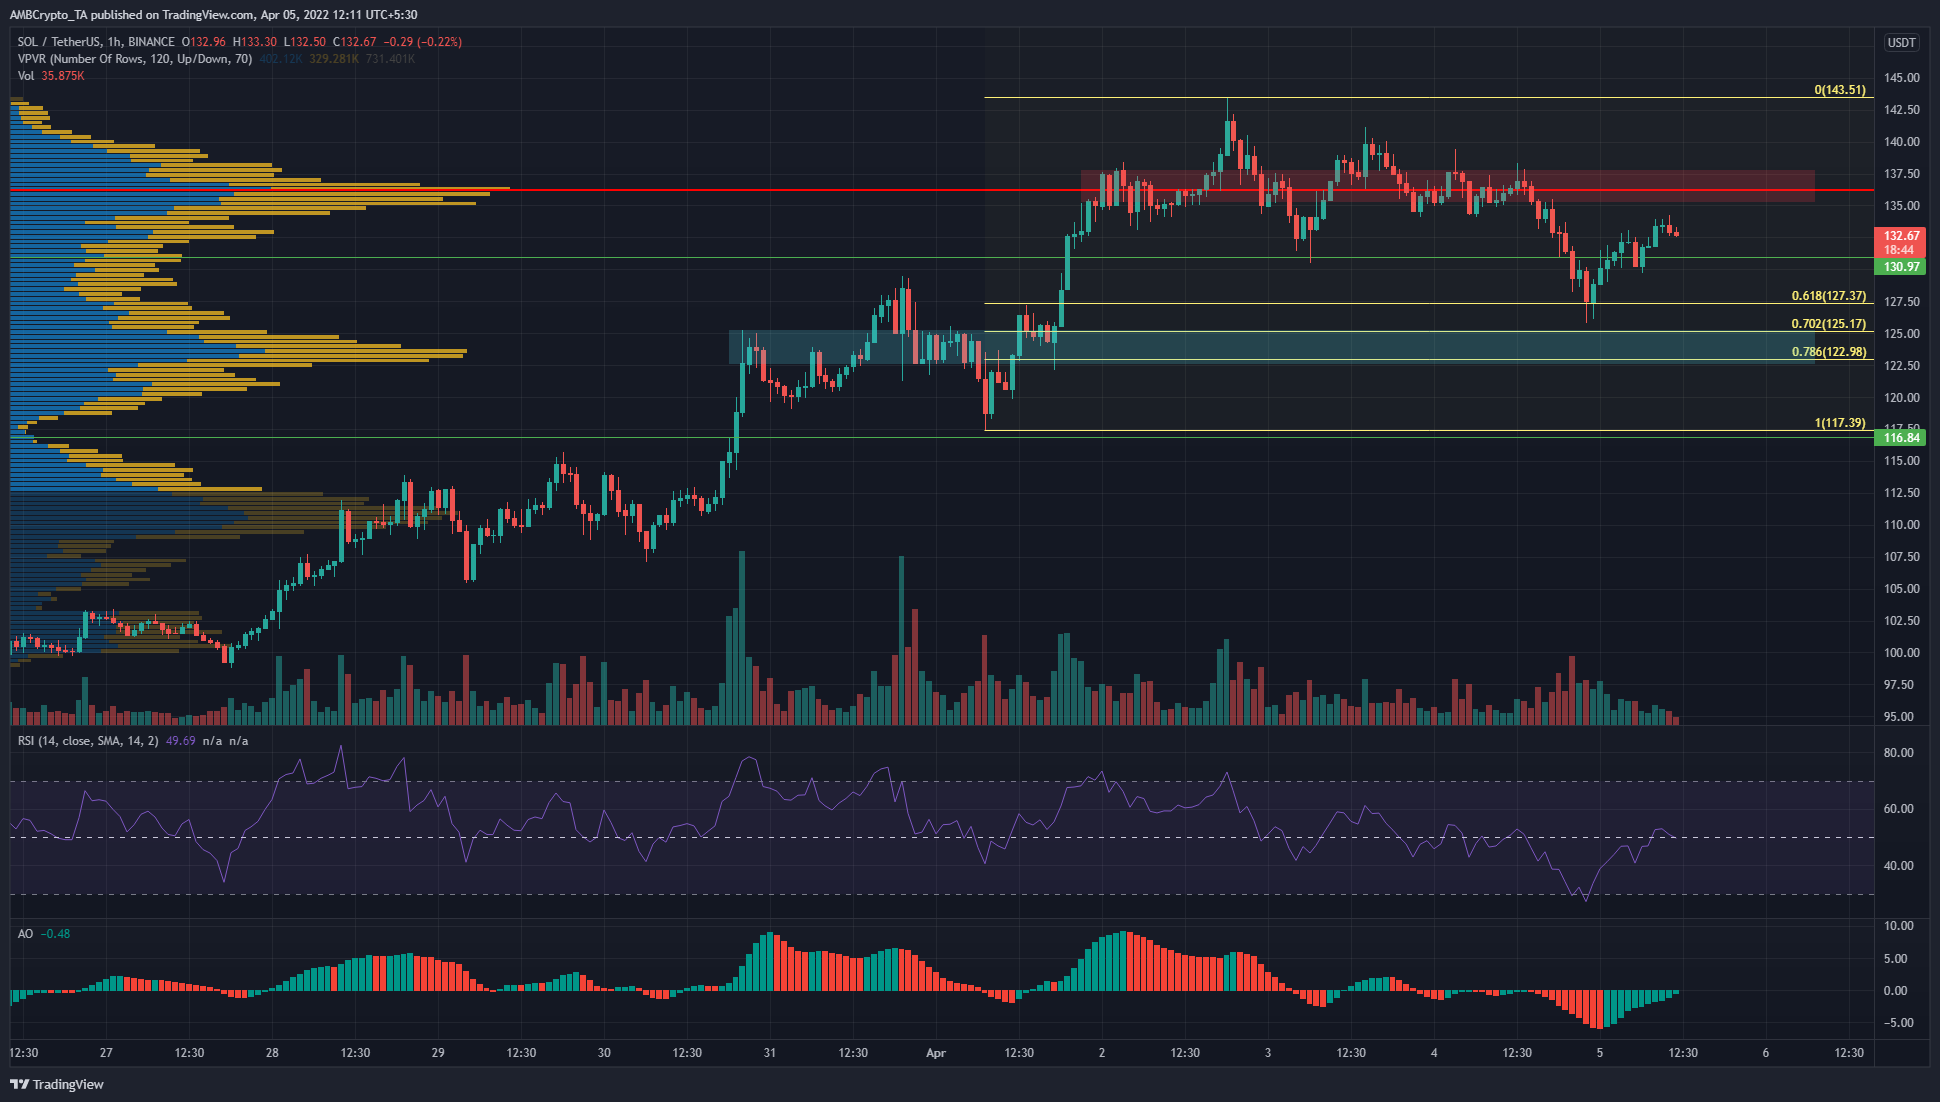
Source: SOL/USDT on TradingView
The Volume Profile Visible Range showed that the Point of Control lay at $136, and indeed this area has acted as a zone of resistance in the past few days. In early January also, this area (red box) offered support, so it does have historical significance.
Moreover, another high-volume node was identified on the VPVR at $122 (cyan box). Hence, in the short term, these two areas are places where SOL can be sold and bought. The Fibonacci retracement levels also gave some confluence to mark $122-$125 as an area to buy.
The RSI and the Awesome Oscillator showed neutral momentum, which meant patience was necessary before assessing an opportunity a few hours later.
IOTA
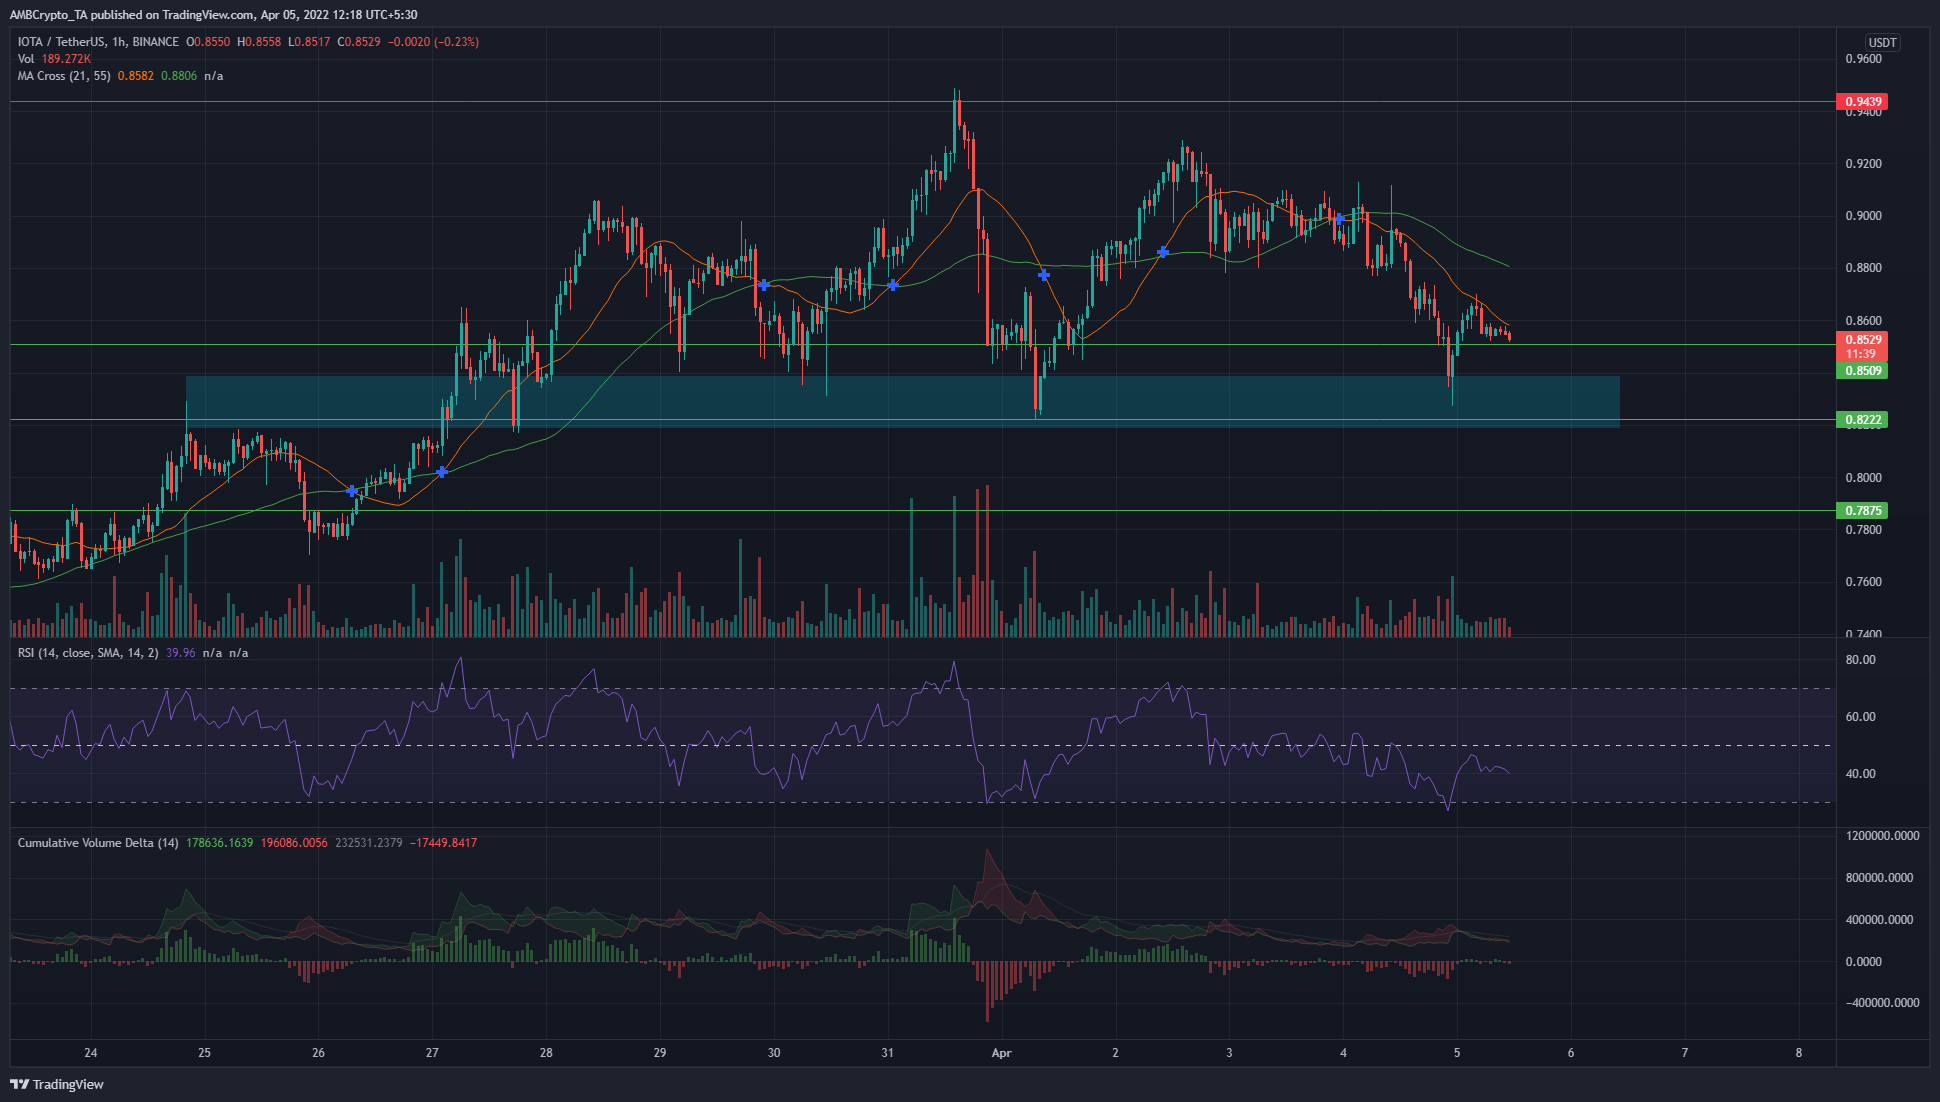
Source: IOTA/USDT on TradingView
IOTA has a bullish order block in the $0.83 area (cyan box). In the past ten days, the price has faced resistance in this zone and subsequently flipped to demand. Therefore, another test in this area could offer a short-term buying opportunity.
The 21 and 55-period SMA’s formed a bearish crossover a couple of days ago, while the RSI also fell beneath neutral 50. This showed bearish momentum. The CVD did not lean in favor of the buyers or the sellers either for IOTA.
Convex Finance (CVX)
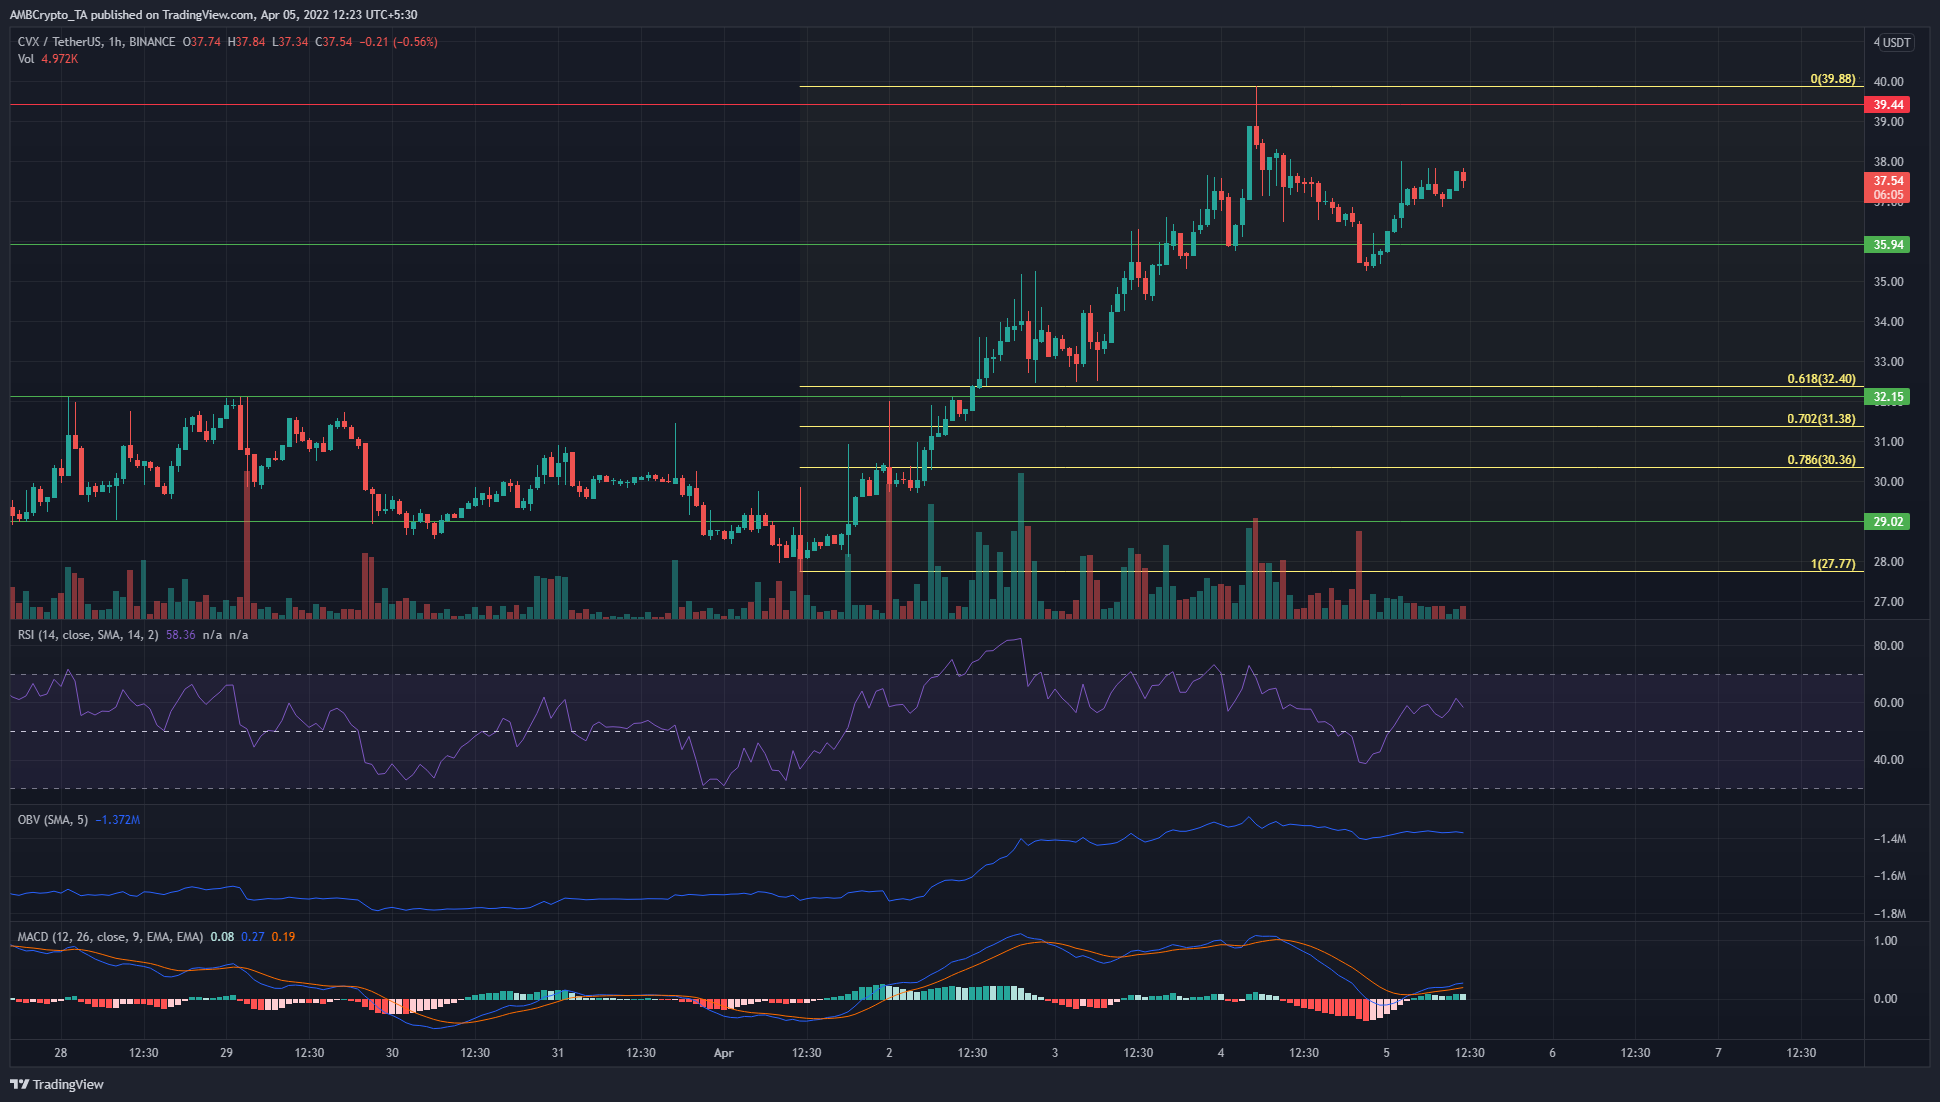
Source: CVX/USDT on TradingView
The impulse move from $27.77 to $39.88 in the past week was used to plot Fibonacci retracement and extension levels. Moreover, horizontal support and resistance levels at $35.9, $39.4, and $43.1 are also important levels for CVX in the next few days.
The RSI rose above neutral 50 to stand at 58.36, while the MACD also formed a bullish crossover above the zero line, to denote bullish momentum on the rise. The OBV has also seen a pullback at the same time CVX dropped to $35 and was rising once more. Hence, a move toward $39 and $43 appeared possible.