
- MANA saw its largest transactions during the trading session on 20 February.
- Readings on the price chart suggest that MANA’s price might see a further decline.
In a significant development for leading metaverse-based token Decentraland [MANA], one of the largest transactions of all time took place on its network during intraday trading session on 20 February.
How much are 1, 10, 100 MANA worth?
According to on-chain data provider Santiment, 256.31 million MANA tokens were moved out of a known whale address.
? #Decentraland had one of its largest transactions of all time on its network today, with 256.31M $MANA moved out of a known whale address. This move was worth $190.2M. Typically, these massive transactions foreshadow price swings in a new direction. https://t.co/ZK625yXZ1q pic.twitter.com/AVKKtT6lNV
— Santiment (@santimentfeed) February 20, 2023
Will MANA’s price sink or swim?
Large transactions of this nature often foreshadow significant price swings in a new direction. In reaction to the huge transaction volume, MANA’s price rose by 2% in the last 24 hours, and trading volume was up by almost 20% during the same period.
Looking at the daily chart, there were indications that the price of the altcoin may experience a drawdown.
Following several weeks of a price rally, a look at the token’s moving average convergence/divergence (MACD) revealed that it commenced a new bear cycle at the beginning of February. MANA’s price peaked at $0.83 on 2 February and has since declined by 12%. Per data from CoinMarketCap, it exchanged hands at $0.73 at the time of writing.
Further, for most of the month, MANA’s price traded below the middle line of the Bollinger Bands. This is often taken as an indication of weakening price action and a lingering downtrend.
A look at the Aroon Up Line (Orange) confirmed the weakened uptrend in MANA’s price. At press time, this was pegged at 7.14%. When an asset’s Aroon Up line is close to zero, the uptrend is weak, and the most recent high was reached a long time ago. It often suggests that a further price decline is imminent.
Realistic or not, here’s MANA’s market cap in BTC’s terms
Moreover, key momentum indicators were spotted in decline and have been positioned since the end of January. For example, MANA’s Money Flow Index (MFI) had breached its neutral line to rest at 43.70 at press time. Likewise, the Relative Strength Index (RSI), which was at 55, was on a downtrend and appeared to be heading towards dropping below its neutral line as well.
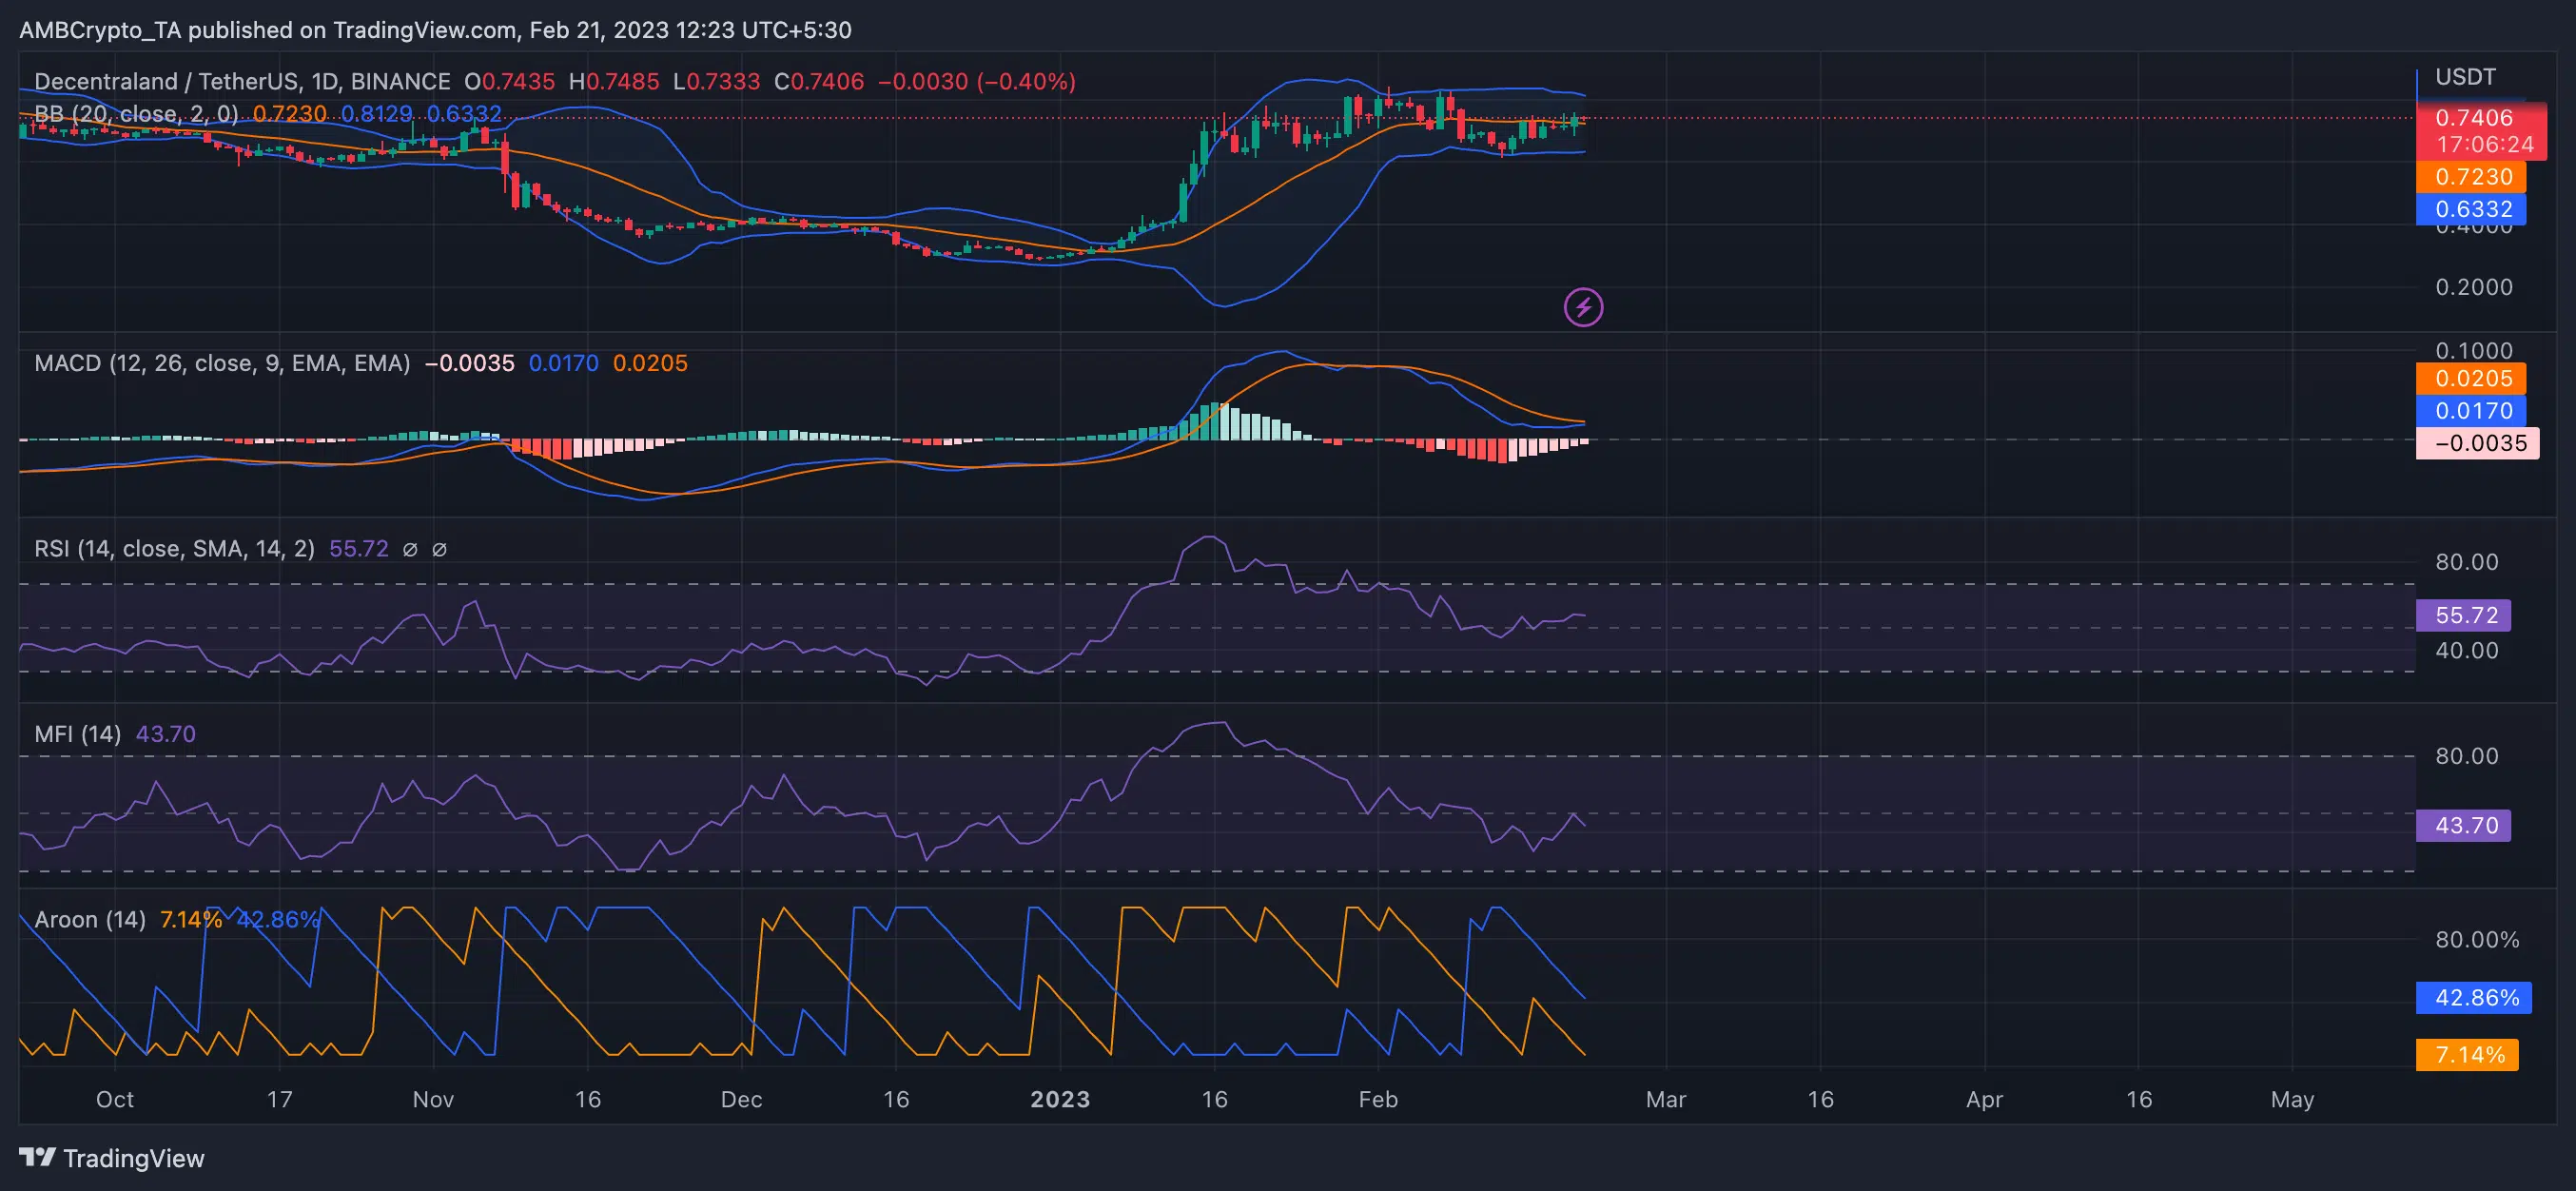
Source: MANA/USDT on TradingView
Lastly, data from Coinglass revealed a steep decline in MANA’s Open Interests since 16 January. Within that period, this declined by 47%. MANA’s Open Interests across leading exchanges stood at $51 million as of this writing.
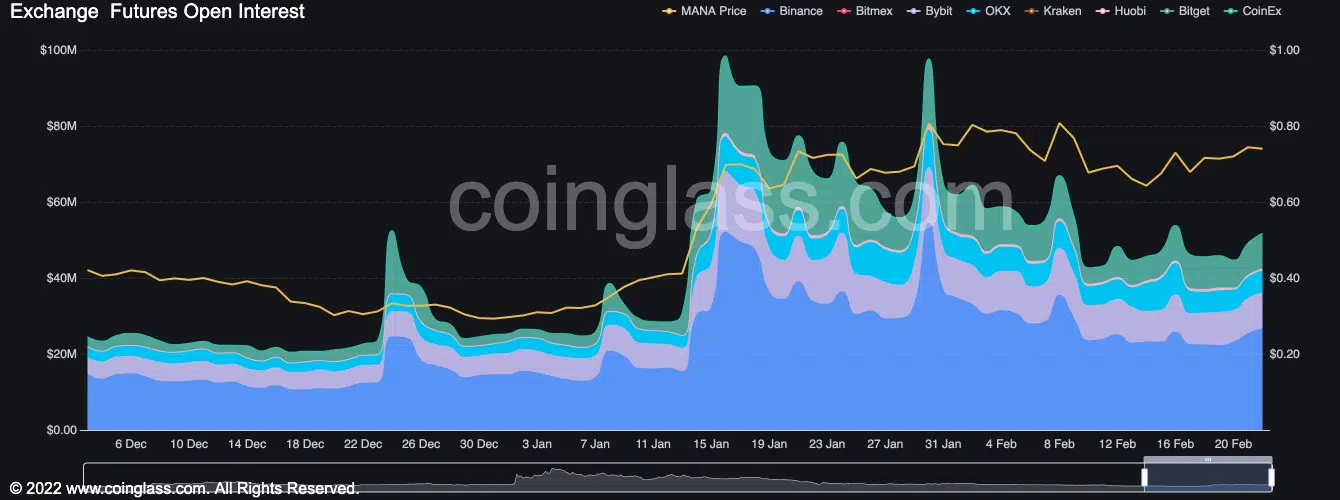
Source: Coinglass