


The technical chart of the AMP token indicates a sideways trend. However, today this token price surged 40% in its intraday session due to its listing on the famous cryptocurrency exchange ‘Binance’. The token price is currently trying to breach the overhead resistance of
Key technical points:
- The daily RSI chart shows a bearish divergence concerning AMP price
- The intraday trading volume in the AMP token is $446.7 Million, indicating a 1499% gain
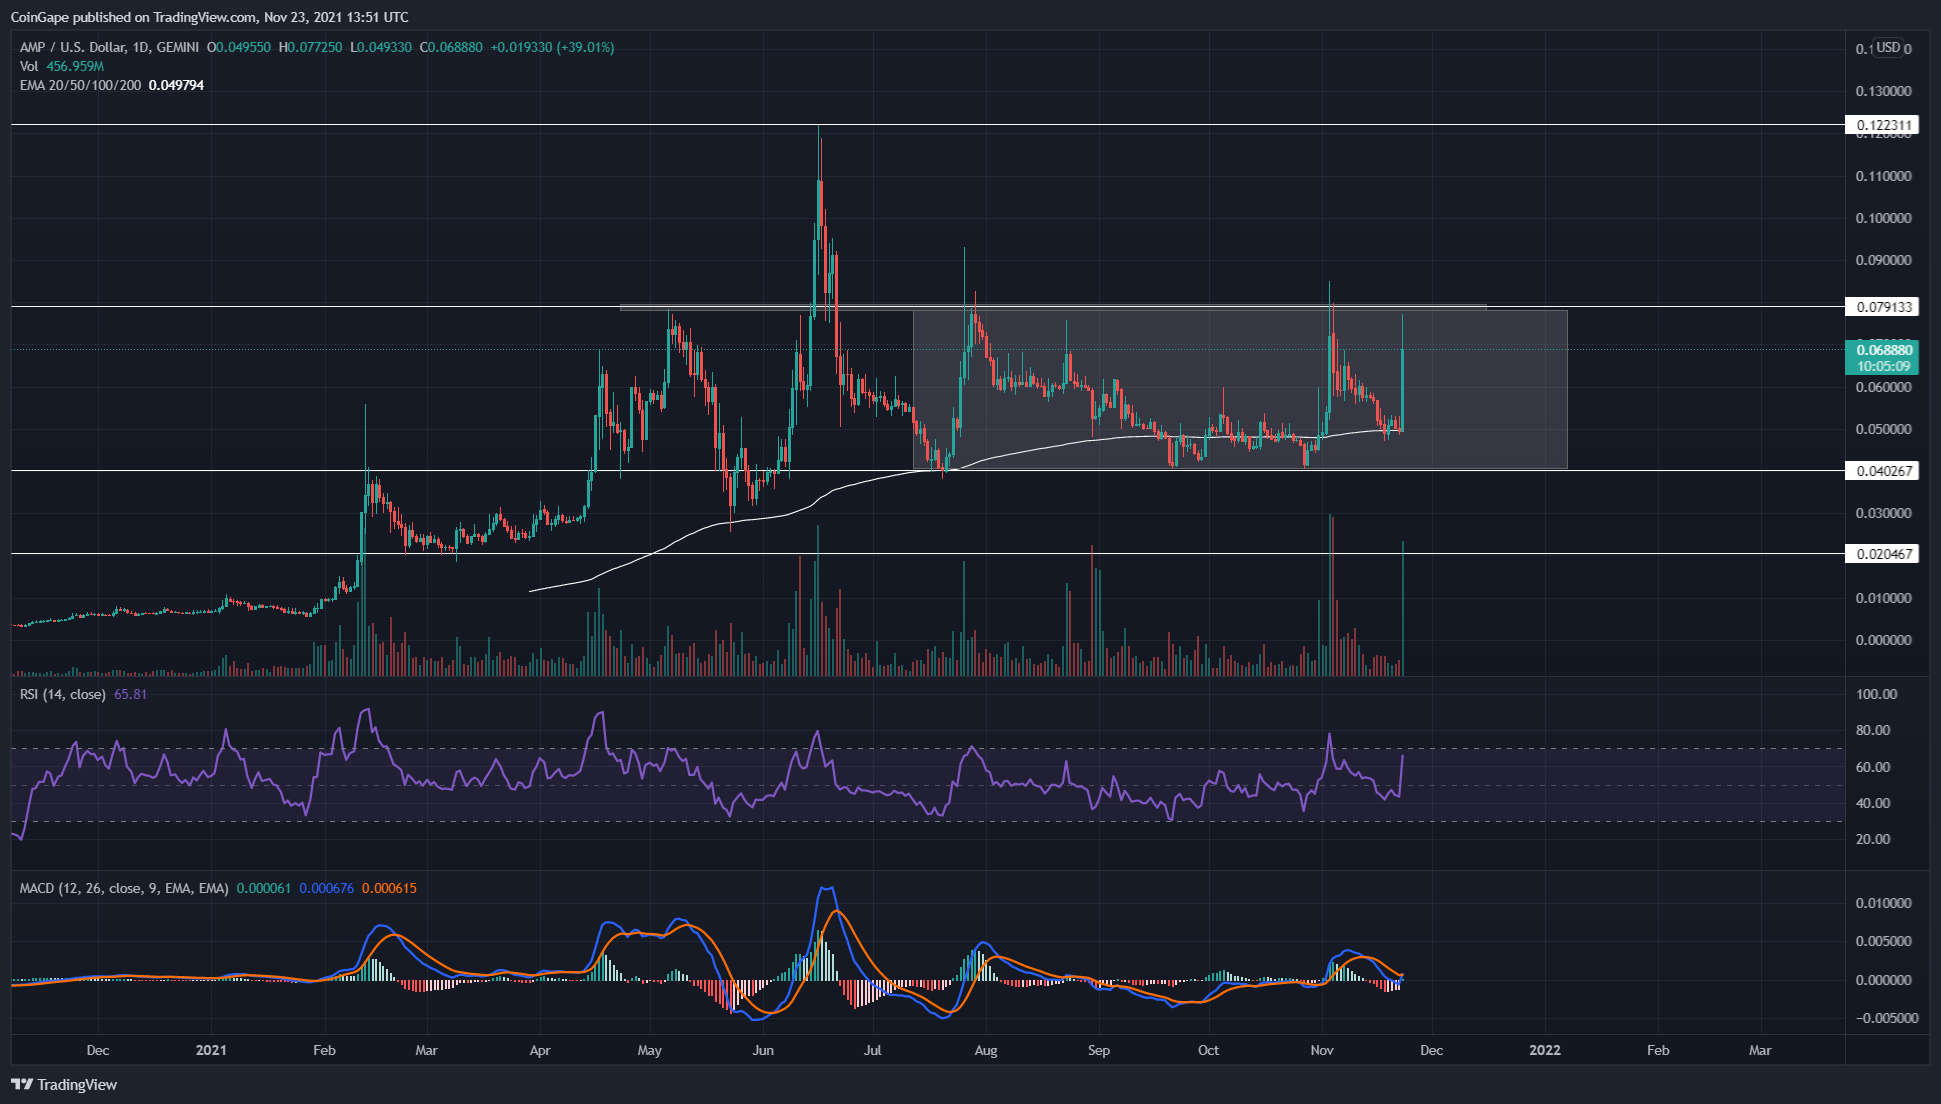
Source- AMP/USD chart by Tradingview
After the AMP token rally was rejected from the $0.122 mark(All-Time High), the bloodbath in June dropped the token price below $0.0791 support. The token managed to sustain above this $0.04 support, but its price has been resonating in this confined range since then.
Recommended Articles


The token wavered within this range for more than five months, bouncing from one extreme level to another. However, today, the token price gained 40% in the intraday session and indicated a massive boost in its volume activity.
This sudden spike was caused by the listing announcement of AMP tokens on the well-known cryptocurrency exchange, ‘Binance’. This positive news caught the attention of several crypto investors, resulting in AMP price rallying the crucial resistance of $0.0791.
Technical indicators
As per the crucial EMAS(20, 50, 100, and 200), the token price is moving above these EMA lines, indicating a bullish trend. Moreover, these lines can also provide good support to the token in case of a price correction.
The Relative Strength Index value at 66 supports the bullish sentiment for this token. However, the RSI line also displays a decent bearish divergence in its chart, indicating some token price weakness.
The Moving average convergence divergence indicator shows both the MACD and signal line were dropped near the neutral zone(0.00). However, with the sudden price spike, the indicator still maintains its bullishness and offers a bullish crossover.
Should you buy?
The AMP price is struggling to breach the overhead resistance of its definite range. Therefore, for a long trade, these traders should wait for the price for a proper break out from this resistance to obtain an entry opportunity.
.
.
- OpenAI CEO Apologizes for Equity Cancellation Clause
- Analyst Predicts Ethereum ETF to Trigger Major ETH Market Moves
- Genesis Creditors to Receive 97% Payout by May Following Court Nod
- Terra Luna Classic Community Votes on Reactivating IBC, LUNC Price to Rally?
- US House to Vote on Two Landmark Crypto Bills Next Week
- Shiba Inu Price Analysis Hints 35% Upside as Buyers Break 50-Day Consolidation
- Solana Price Prediction: Can SOL Surpass the $200 Milestone By End Of This Weekend?
- Ethereum Price Analysis: ETH Sees End-of-Correction With This Resistance Breakout
- Turn $1 Into $100 This Week With 3 Altcoins To Buy
- Crypto Market Analysis 18/5: Will Bitcoin Regain $70000 this Weekend?


