
Disclaimer: The findings of the following analysis are the sole opinions of the writer and should not be considered investment advice.
Since November 2021, Stellar Lumens has registered a series of lower highs on the price charts. There were individual rallies upward for the crypto asset, such as a 28% rally in early February and another 30% move upward in March. Yet, the overall direction has been to the south, and this trend appeared likely to continue in the days to come.
XLM- 1 Day Chart
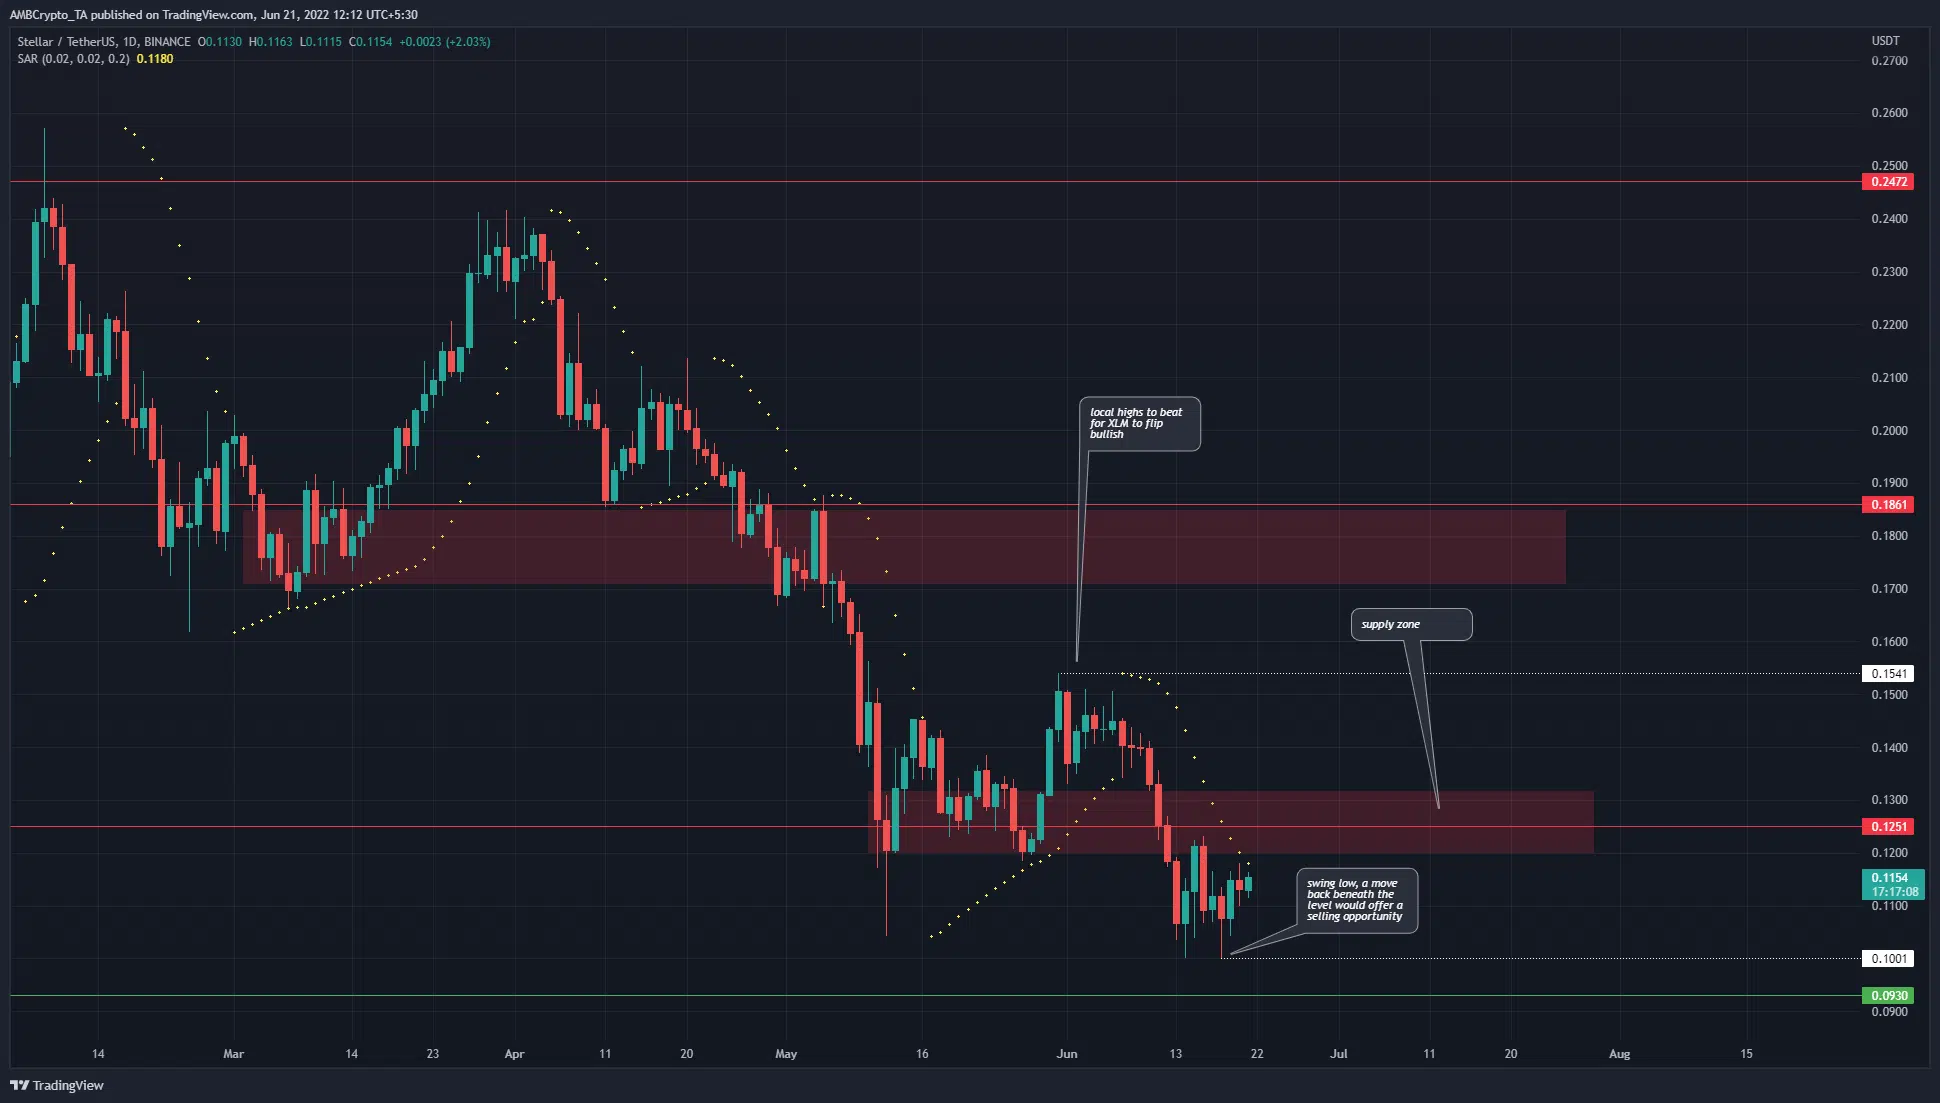
Source: XLM/USDT on TradingView
In mid-March, along with most other altcoins, XLM also saw a rapid surge upwards. It rose from $0.18 to $0.24, a near 30% move in just over two weeks. In April and May, the sentiment shifted bearish once more, as it had been since January.
Stellar Lumens fell beneath the $0.18 support and retested the same level as resistance before plunging yet again. In May, it reached the $0.1 lows and revisited these lows in June as well.
The market structure was firmly bearish in recent weeks. To the north, the $0.125 and $0.154 resistance levels loom large. The $0.154 is a local high and would need to be broken for the longer-term structure to flip to the bullish side.
The $0.12-$0.13 resistance zone appeared to be firmly in the hands of the sellers. A move to this area would more likely see the continuation of the downtrend than a trend reversal.
Rationale
Source: XLM/USDT on TradingView
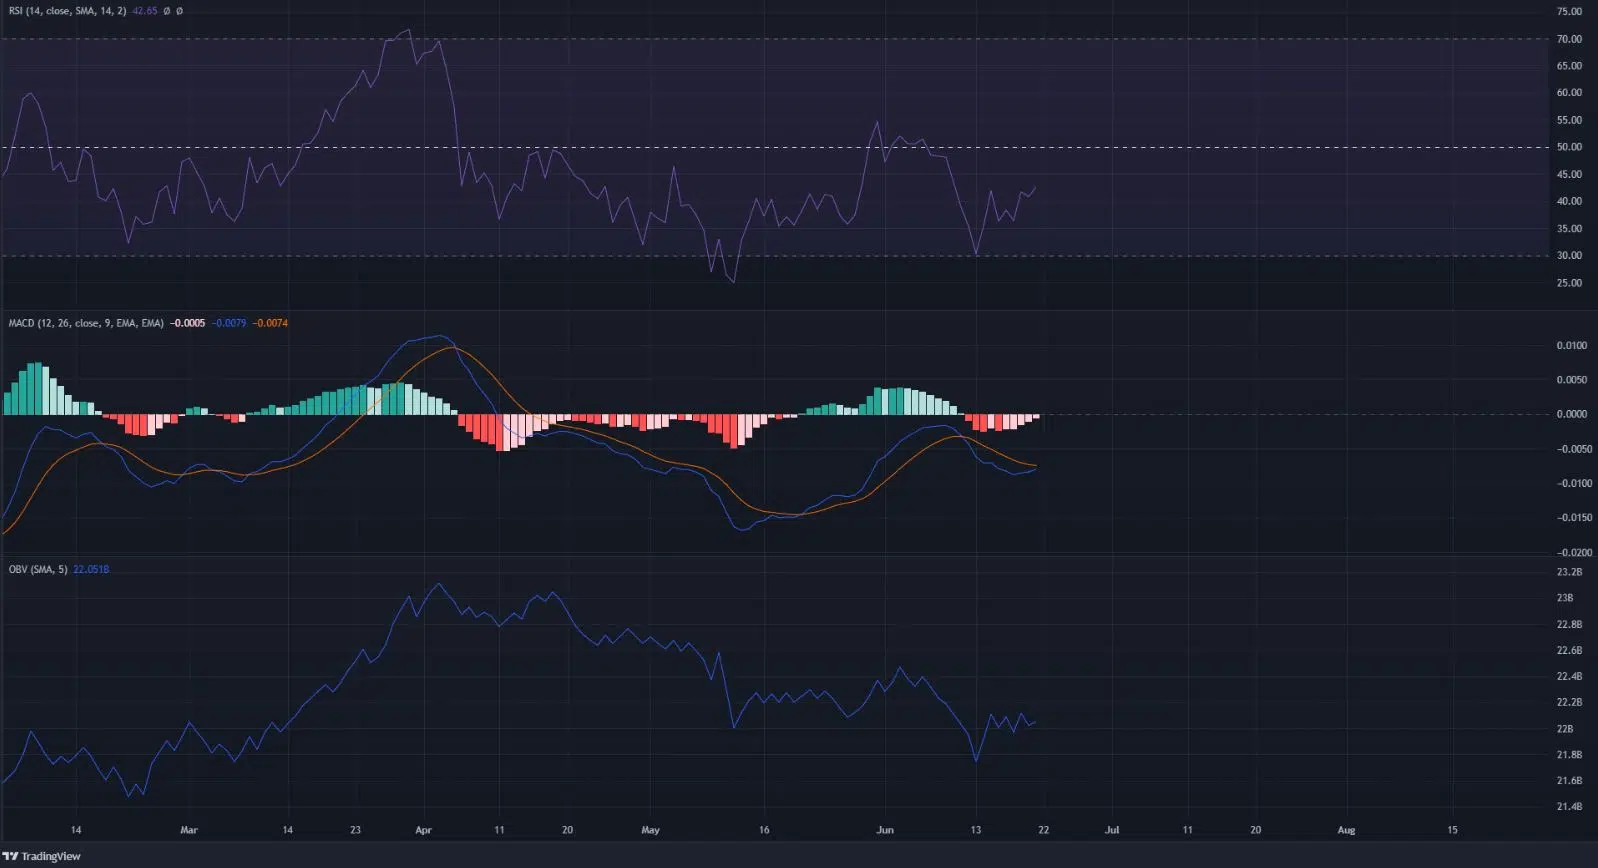
The momentum indicators on the daily timeframe also painted a bearish picture. The RSI has been below neutral 50 since April, a sign of the downward momentum behind XLM. The MACD was also beneath the zero line. Hence, at press time, the momentum remained pointed southward, although a small push upward to $0.12-$0.13 could occur.
To exacerbate buyers’ woes, the OBV has been in decline since April as well. This indicated selling volume was greater than the buying volume and acted to confirm the downtrend. The OBV did not signal a trend reversal either. The Parabolic SAR (dotted white on price charts) also gave a sell signal at the time of writing.
Conclusion
Until the $0.12-$0.13 resistance zone was flipped to a demand zone, the longer-term bias for Stellar Lumens would remain bearish. A move to this supply zone would likely offer selling opportunities.