TRX Price Retests Channel Break, A Dip To Buy Or Wait?
Author: Sohrab Khawas 
Sohrab Khawas 
Author
Sohrab is a passionate cryptocurrency news writer with over five years of experience covering the industry. He keeps a keen interest in blockchain technology and its potential to revolutionize finance. Whether he's trading or writing, Sohrab always keeps his finger on the pulse of the crypto world, using his expertise to deliver informative and engaging articles that educate and inspire. When he's not analyzing the markets, Sohrab indulges in his hobbies of graphic design, minimal design or listening to his favorite hip-hop tunes.

Nov 17, 2023 14:06
Sohrab Khawas

Author
Sohrab is a passionate cryptocurrency news writer with over five years of experience covering the industry. He keeps a keen interest in blockchain technology and its potential to revolutionize finance. Whether he's trading or writing, Sohrab always keeps his finger on the pulse of the crypto world, using his expertise to deliver informative and engaging articles that educate and inspire. When he's not analyzing the markets, Sohrab indulges in his hobbies of graphic design, minimal design or listening to his favorite hip-hop tunes.
TRX price trend performs a pullback move to retest the bullish breakout of the rising channel.
The TRX price consolidates above the psychological mark of $0.10 for three days.
With a successful retest, the TRX price can cross the $0.115 mark to test $0.125.
The TRX price continues the sideways trend as it consolidates despite the Bitcoin price falling 4.6% to the $36K mark. Surviving the sharp increase in supply pressure observed market-wide, Tron manages to sustain above the psychological mark of $0.10.
As the Tron price remains under a cooldown phase, the TRX price prediction predicts a prolonged uptrend continuation. Moreover, with the possibility of the overall market recovery with the Bitcoin Spot ETF approvals on the verge, the altcoins are ready to surge higher.
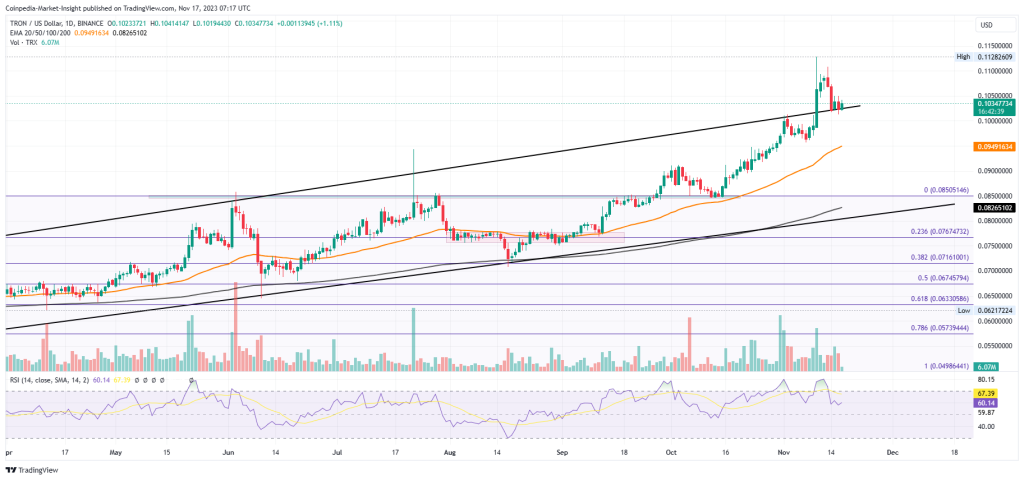
Source- TradingView
Sustaining a bullish trend continuation, the TRX price showcases a 90% Year-to-Date growth as 2023 proves extremely profitable. As the Tron price gains momentum, the uptrend reclaims the $0.10 psychological mark.
Currently trading at $0.1033, TRX shows an intraday growth of 0.98%, forming a bullish candle. However, the price action analysis displays a consolidation phase in Tron prices as they retest the $0.10 mark.
The retest phase kicks in after the TRX price gives a rising channel breakout as the supply pressure increases at $0.112. Further, the recent trend shows a bullish engulfing candle struggling to gain momentum and ignite a post-retest reversal.
Technical Indicators:
RSI Indicator: The daily RSI line dips from the bullish territory to cross under the overbought boundary and tease a drop to the halfway line.
EMA: The 50-day and 200-day continue to rise higher in a bullish alignment to support any shortcomings in trend momentum.
Will TRX Price Reach $0.10?
Surviving the market-wide pullback, the TRX price trend consolidates to retest the broken resistance trendline. Further, the buyers remain dominant over the psychological mark of $0.10 and project a high likelihood of a bullish reversal from $0.10. Sustaining the bullish momentum, the uptrend can reach the $0.125 mark.
Conversely, a reversal rally under the $0.10 mark can drive the prices down to the 50-day EMA at $0.0949.