
Disclaimer: The findings of the following analysis are the sole opinions of the writer and should not be considered investment advice.
While the sellers finally deny the bears an extended sell-off privilege at the $11.8 baseline, WAVES flipped the month-long trendline resistance to support. But the 23.6% Fibonacci resistance suspended its 24-hour bull rally.
As the recent growth entailed a rising wedge setup, a possible close below the pattern could cause near-term setbacks on the chart. At press time, WAVES was trading at $15.79, up by a staggering 17.32% in the last 24 hours.
WAVES 4-hour Chart
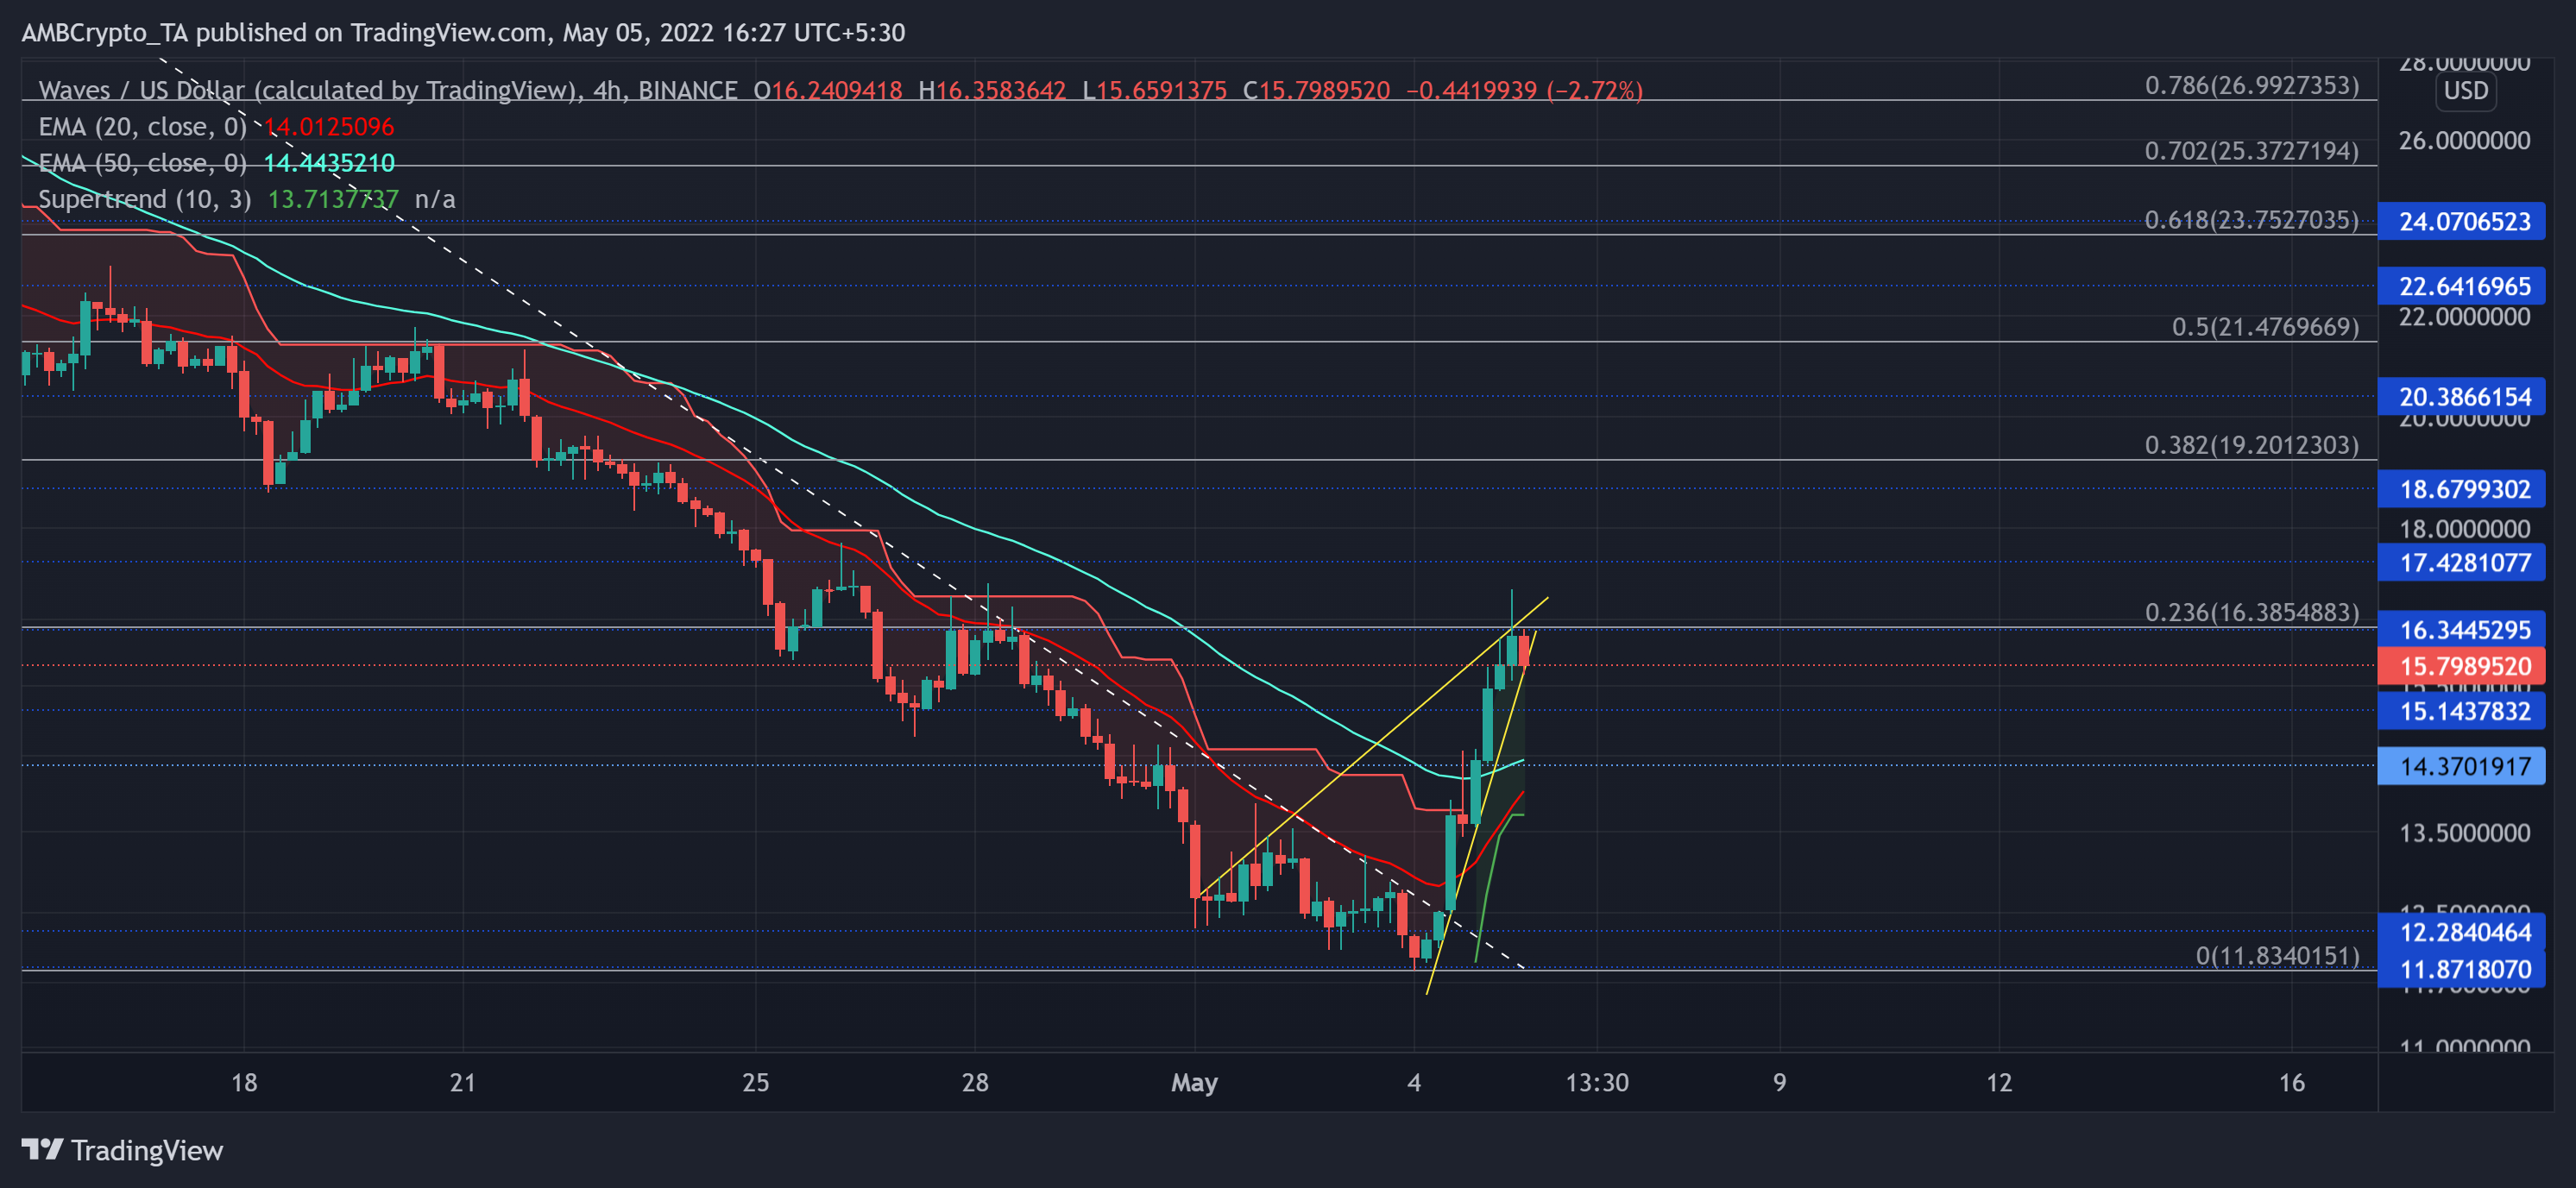
Source: TradingView, WAVES/USD
WAVES steeply glided south since the start of April while piercing through vital price points. The altcoin lost over 81% of its value from its 31 march ATH and swooped toward its nine-week low on 4 May.
While the $11-$12 range exhibited renewed buying pressure, the bulls finally challenged the sharp downtrend. In doing so, they put WAVES above the 20 EMA (red) and the 50 EMA (cyan). Accordingly, the Supertrend changed its stance from the red zone to support the buying market.
A compelling close below the current pattern could lead to a short-term slide toward the $14-zone. With the 20 EMA recouping on its northward journey, it could serve as testing support for immediate retracements. Should the bulls insist and reiterate their revival instincts, they would then aim for a retest of the 23.6% level.
Rationale
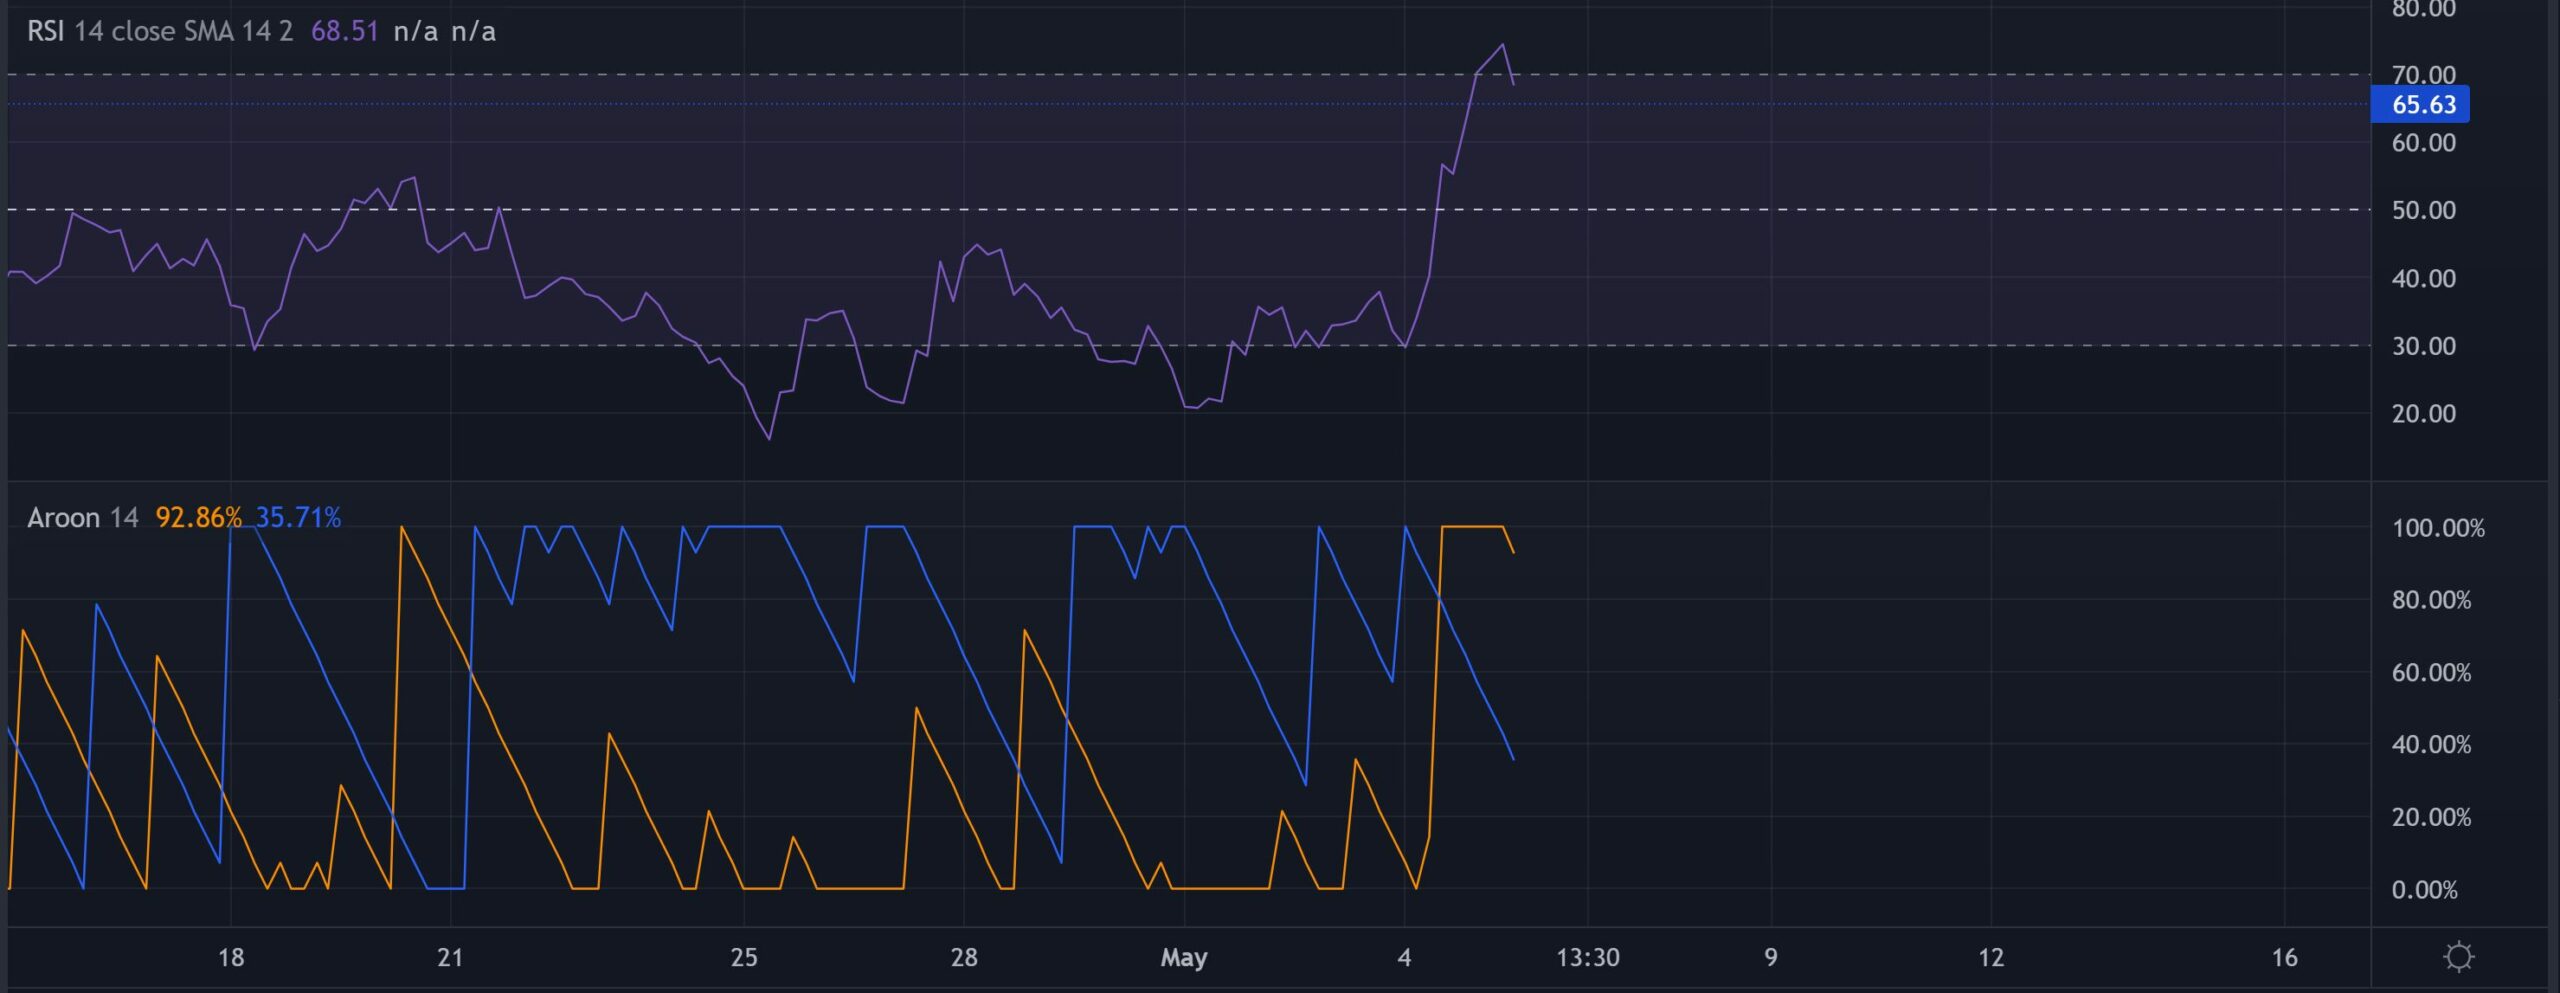
Source: TradingView, WAVES/USD
The Relative Strength Index finally pointed south from its overbought territory. A move below 65 would indicate further ease in buying power. In which case, toppling the 23.6% level would require a fresh bull run on heightened volumes.
Moreover, after testing the 100% level in the past day, the Aroon up (yellow) showed slowing signs as it looked diagonally. A likely retracement of this indicator could delay the chances of an upswing in the coming times.
Conclusion
In light of the rising wedge set up at the brink of 23.6% Fibonacci resistance alongside the overbought readings on the RSI, WAVES could face a short-term plunge. Should the bulls hold their grounds, the $14-zone could assume a bounce-back level for this potential drop.
Ultimately, investors/traders must keep a close watch on Bitcoin’s movement affecting the overall perception of the market.