


- HBAR price is up nearly 95% over the last week
- HBAR Price has formed an ascending channel
- 25 MA has continued to act as support
Can HBAR Take Over $1?
Hedera Hashgraph (HBAR) has been outperforming the overall crypto market over the last week as prices have risen nearly 100% from $0.24 to $0.49. HBAR refers to itself as the “trust layer of the internet”. Hedera is a public network that allows individuals and businesses to create powerful decentralized applications (Dapps).
HBAR has been growing in popularity & market cap rankings as its now the 39th largest cryptocurrency. HBAR was designed to be a fairer, more efficient system that eliminates the limitations that older blockchains face.
advertisement
Ever since the large market fall that occurred on September 7th, HBAR has been on an immensely strong uptrend. This uptrend has pushed HBAR price to a new all time high of $0.49. Throughout this period, HBAR price has formed an ascending channel formation (shown in light blue). The top trend of this channel has acted as a major resistance as each time price has reached it, it has gotten rejected back down to the median line of the channel (shown in red).
At the time of writing, HBAR price is trading within a major resistance zone of $0.45-$0.486. If bulls manage to break & hold this zone, we should expect price to reach the target given.
Hedera Hashgraph Price Analysis: HBAR/USDT 4 Hour Chart
Recommended Articles


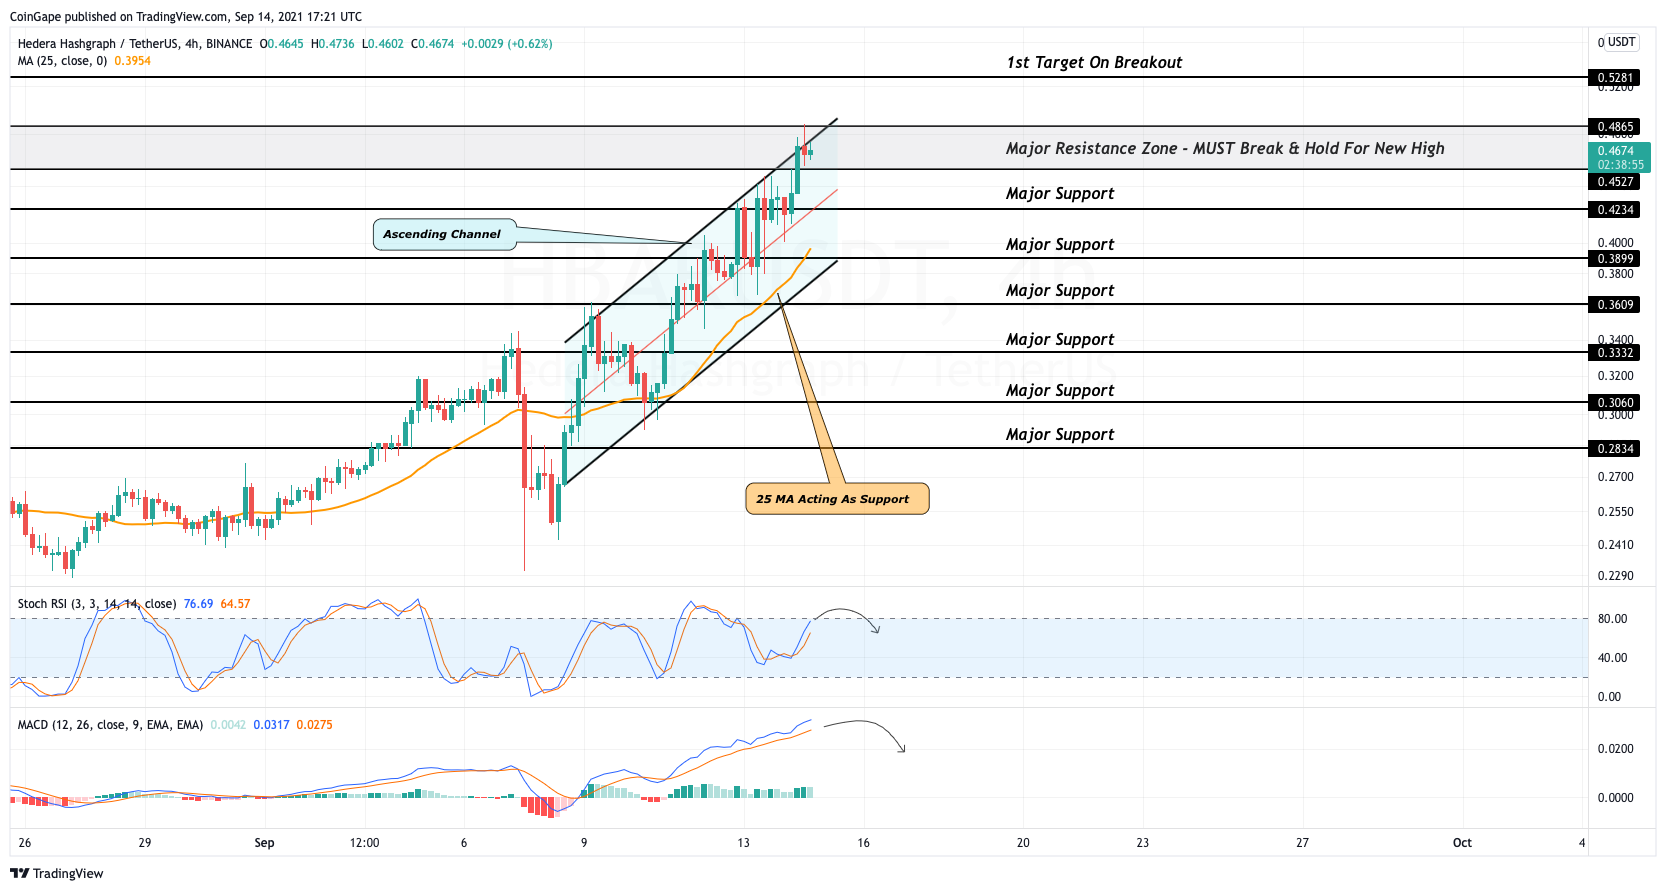
Throughout this run up over the last week, HBAR price has only touched the bottom trend of its ascending channel once. This shows that bulls are immensely in control as price continues to hug the top trend of its channel. At the time of writing, Hedera Hashgraph is trading above a minor support of $0.45.
If bulls lose power & HBAR price gets pulled below this mark, expect prices to drop to the major support of $0.423. If this level fails to hold, expect price to drop further to the major support of $0.389. This would bring HBAR price to the bottom trend of its channel. Along with this trend lies the 25MA. This MA has held for nearly a week now & a break below will likely cause a bearish trend change.
- While looking at the Stochastic RSI, we can see strength is now heading towards the overbought region. If strength continues higher & enters within this zone, HBAR price may be in for a push to a new all time high.
- The MACD has been stuck within a linear uptrend for the past few days. This continues bullish until the blue MA crossed below the orange MA.
HBAR Intraday Analysis
- Spot rate: $0.467
- Trend: Bullish
- Volatility: Medium
- Support: $0.4527
- Resistance: $0.486
- Sui Network Clarifies Misconceptions About Token Supply, Will Price Rally?
- Analysts Predict Biggest Altcoin Market Rally To $4 Trillion Market Cap
- 5 Crypto Whales Aggressively Accumulate PEPE, LINK, and More
- LUNC News: Terra Luna Classic Key Proposal Fails, LUNC Price Stars Rallying
- Peter Brandt Backs Michael Saylor’s Controversial Bitcoin Is King Statement
- Pepe Coin Price Analysis: Will $PEPE Hit $0.00001 in the Coming Week?
- Crypto Price Prediction: Top Meme Coins to Focus As $BTC Sparks Fresh Rally Above $63k
- Uniswap Price Analysis: $UNI Eyes $10 Amid Double Bottom Reversal
- Dogecoin Price Prediction: Is $0.2 a Realistic Target in May 2024?
- SHIB Price Analysis: Can Rising Burn Rate Boost Value to $0.0001 Soon?

 Mallconomy


