

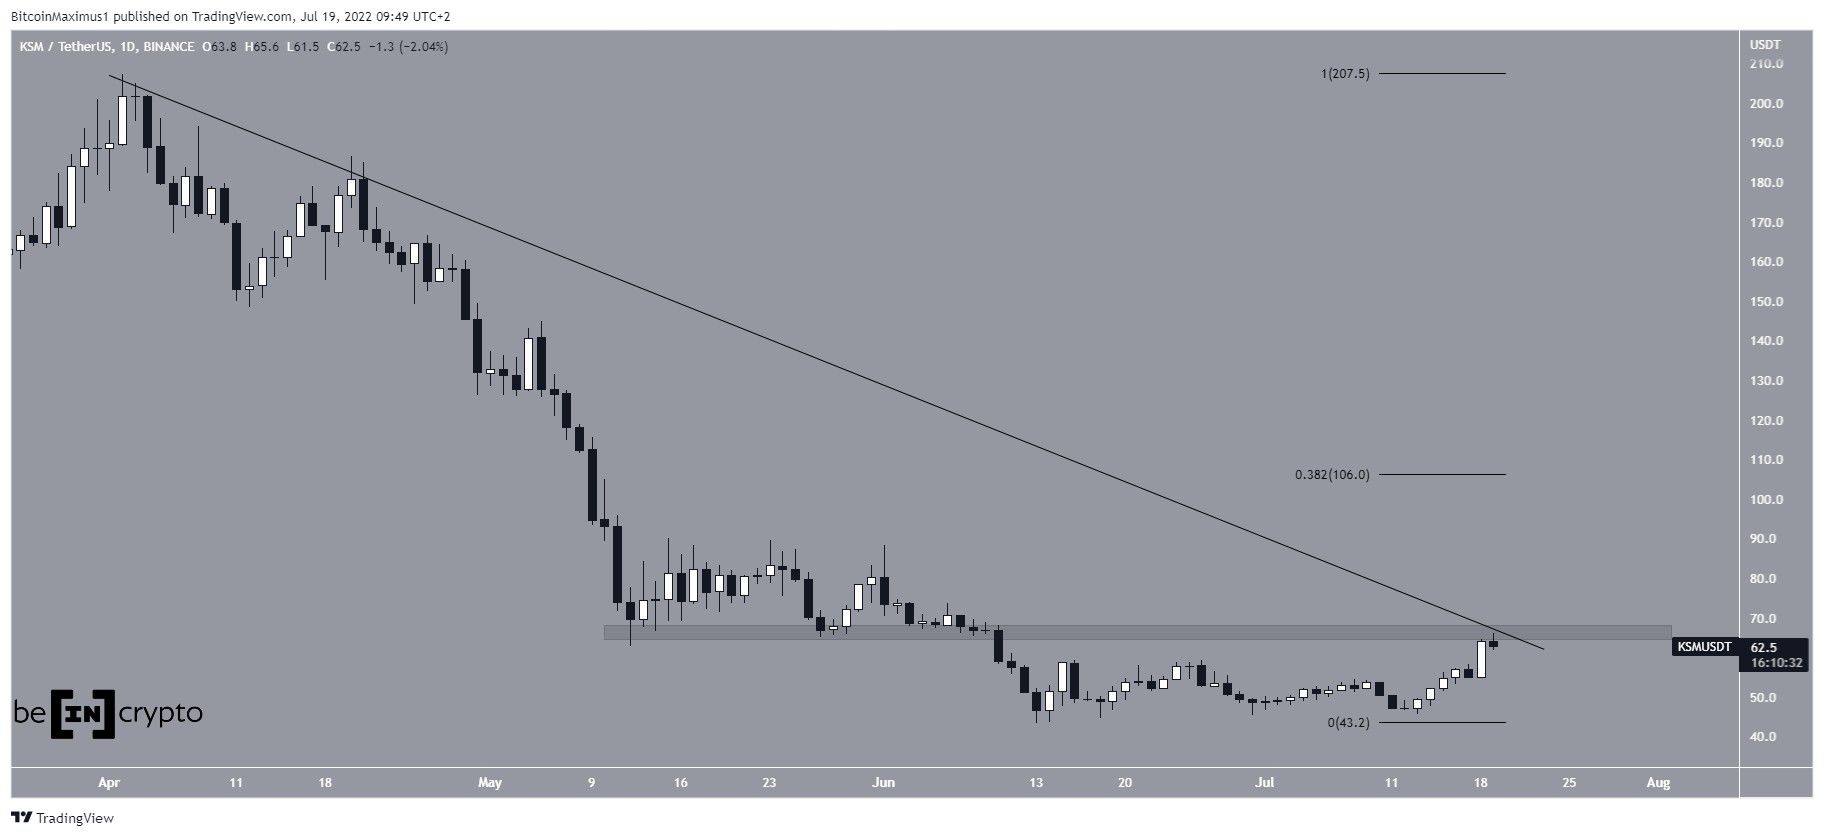
Kusama (KSM) has been moving upwards at an accelerated rate since July 12, but has yet to break out from a descending resistance line.
KSM has been decreasing underneath a descending resistance line since April 3. This led to a low of $43 on June 13.
The price has been increasing since, and accelerated its rate of increase on July 12. However, it has yet to break out from the resistance line. Additionally, the price is facing resistance from the $66 horizontal resistance area.
If it were to break out, the next closest resistance area would be at $106, created by the 0.382 Fib retracement resistance level.
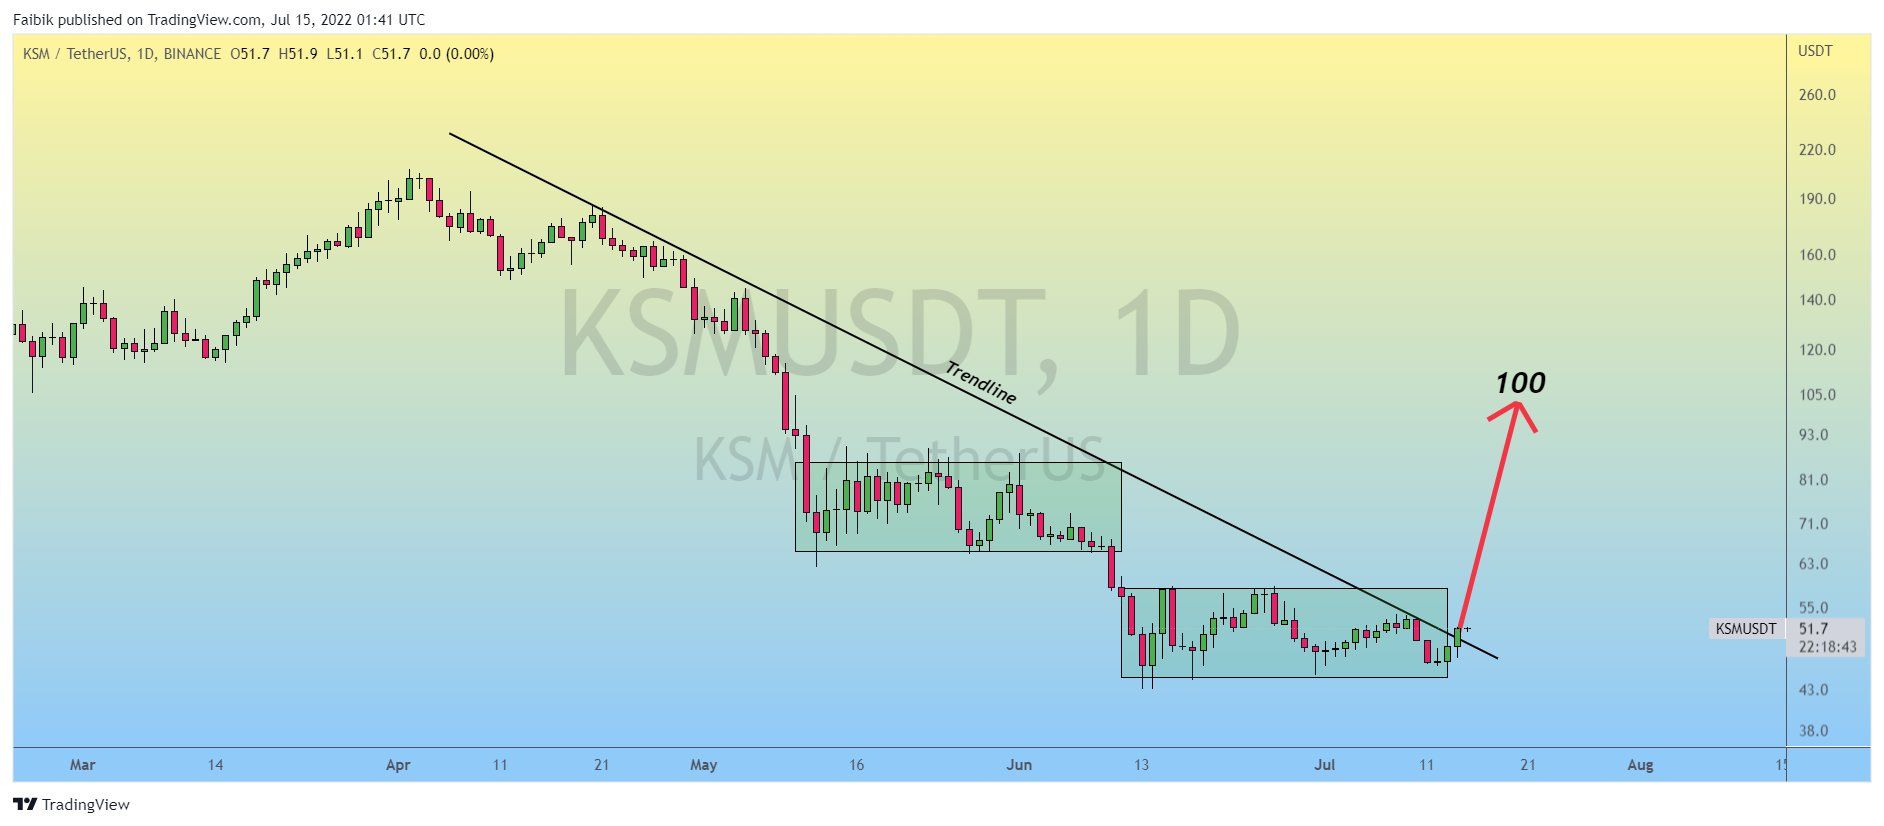
Cryptocurrency trader @CryptoFaibik tweeted a chart of KSM, stating that the price has broken out from a long-term descending resistance line. However, as outlined above, it is not yet certain if the price has broken out from this line.
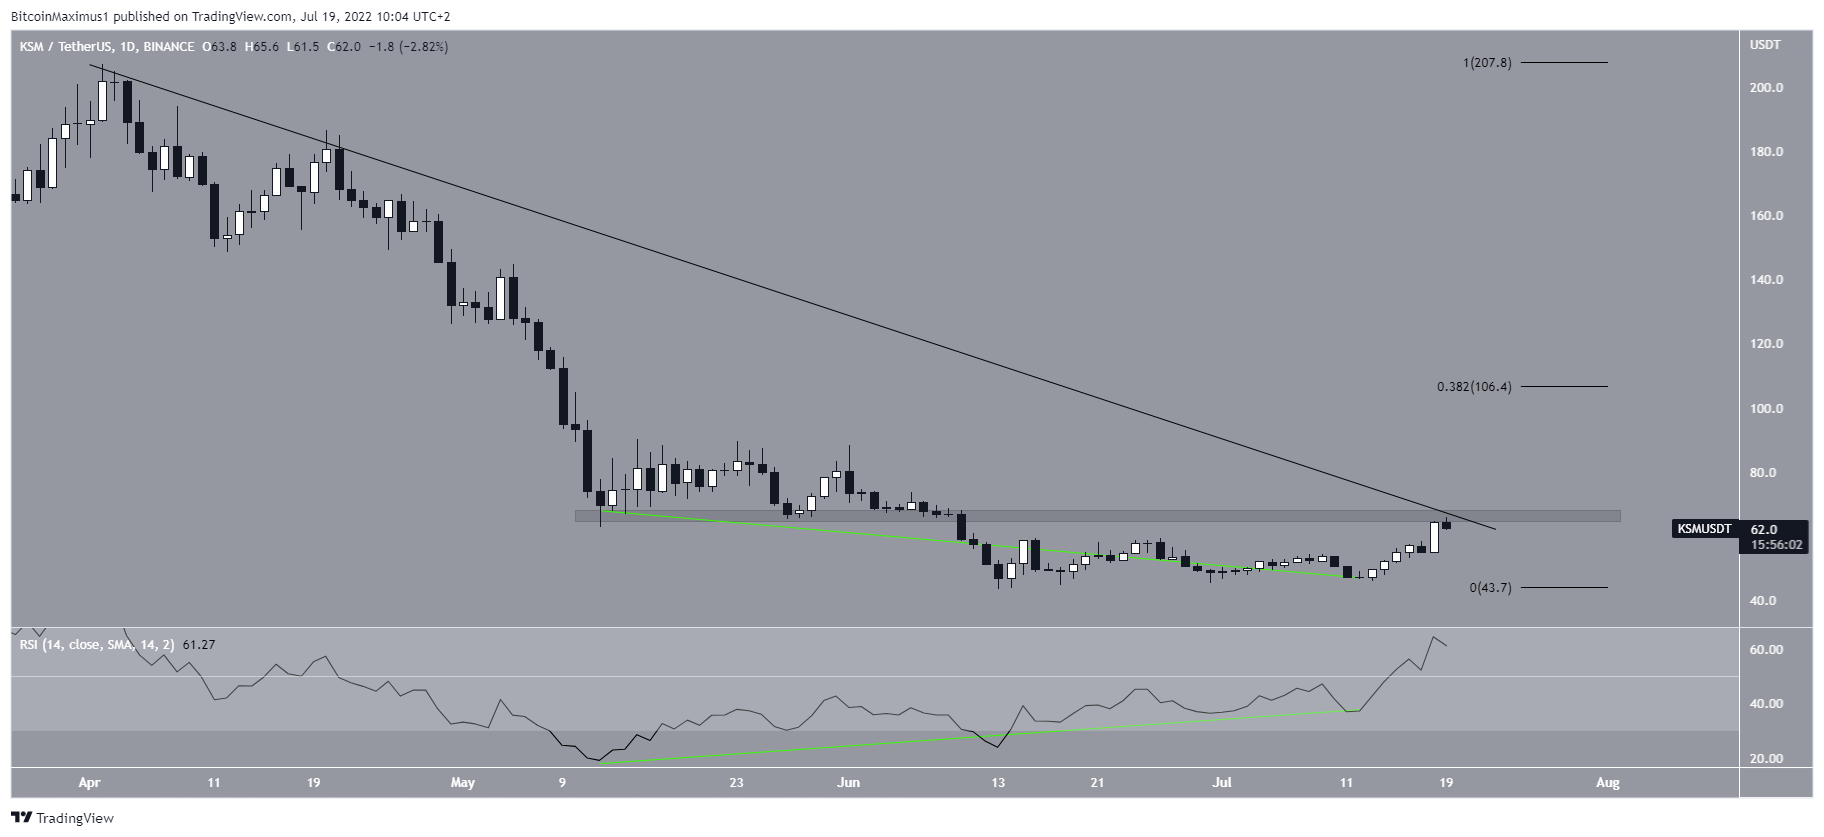
Bullish daily RSI
A closer look at the daily timeframe RSI provide a bullish outlook that suggests the price is likely to break out from the line
The RSI has been generating bullish divergence since May 10, and managed to move above 50 on July 16. Besides the fact that movements above 50 are considered signs of a bullish trend, the indicator also completes a failure swing bottom pattern by moving above the high between the divergences.
So, this reading indicates that an eventual breakout is the most likely scenario.
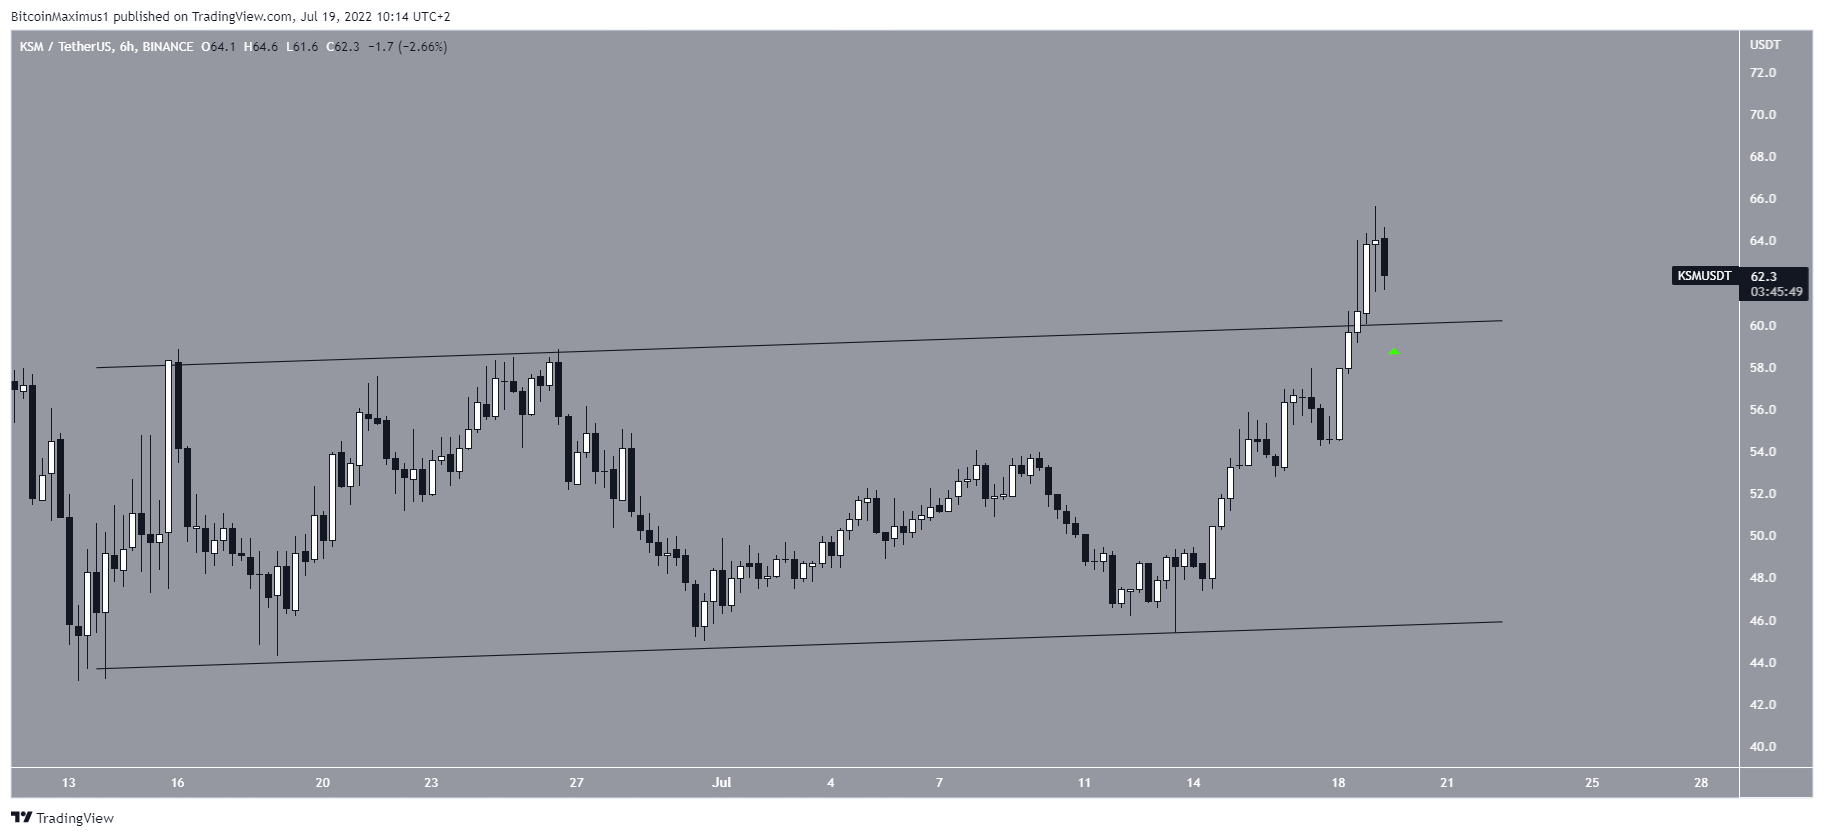
Future KSM movement
Finally, the six-hour chart is also in alignment with the possibility of a breakout. The main reason for this is that the price has already broken out from an ascending parallel channel.
Breakouts from such channels usually indicate that a new upward movement has begun. Currently, the price is in the process of validating the line as support (green icon).
If successful, this would be expected to lead to a breakout from the line.
For Be[in]Crypto’s latest Bitcoin (BTC) analysis, click here
Trusted
Disclaimer
In line with the Trust Project guidelines, this price analysis article is for informational purposes only and should not be considered financial or investment advice. BeInCrypto is committed to accurate, unbiased reporting, but market conditions are subject to change without notice. Always conduct your own research and consult with a professional before making any financial decisions. Please note that our Terms and Conditions, Privacy Policy, and Disclaimers have been updated.
