Analysis

Why Terra Classic [LUNC] may be poised for a 10% dump in the next few days
Posted:
Journalist

Disclaimer: The findings of the following analysis are the sole opinions of the writer and should not be considered investment advice.
Bitcoin [BTC] faced stiff resistance near the $19.6k mark and registered some losses over the previous trading day. Terra Classic [LUNC] also faced significant losses in the past few days.
At the time of writing, a former level of support was flipped to resistance. It seemed likely that LUNC would see another leg down on the price charts in the next day or two.
LUNC- 1-Hour Chart
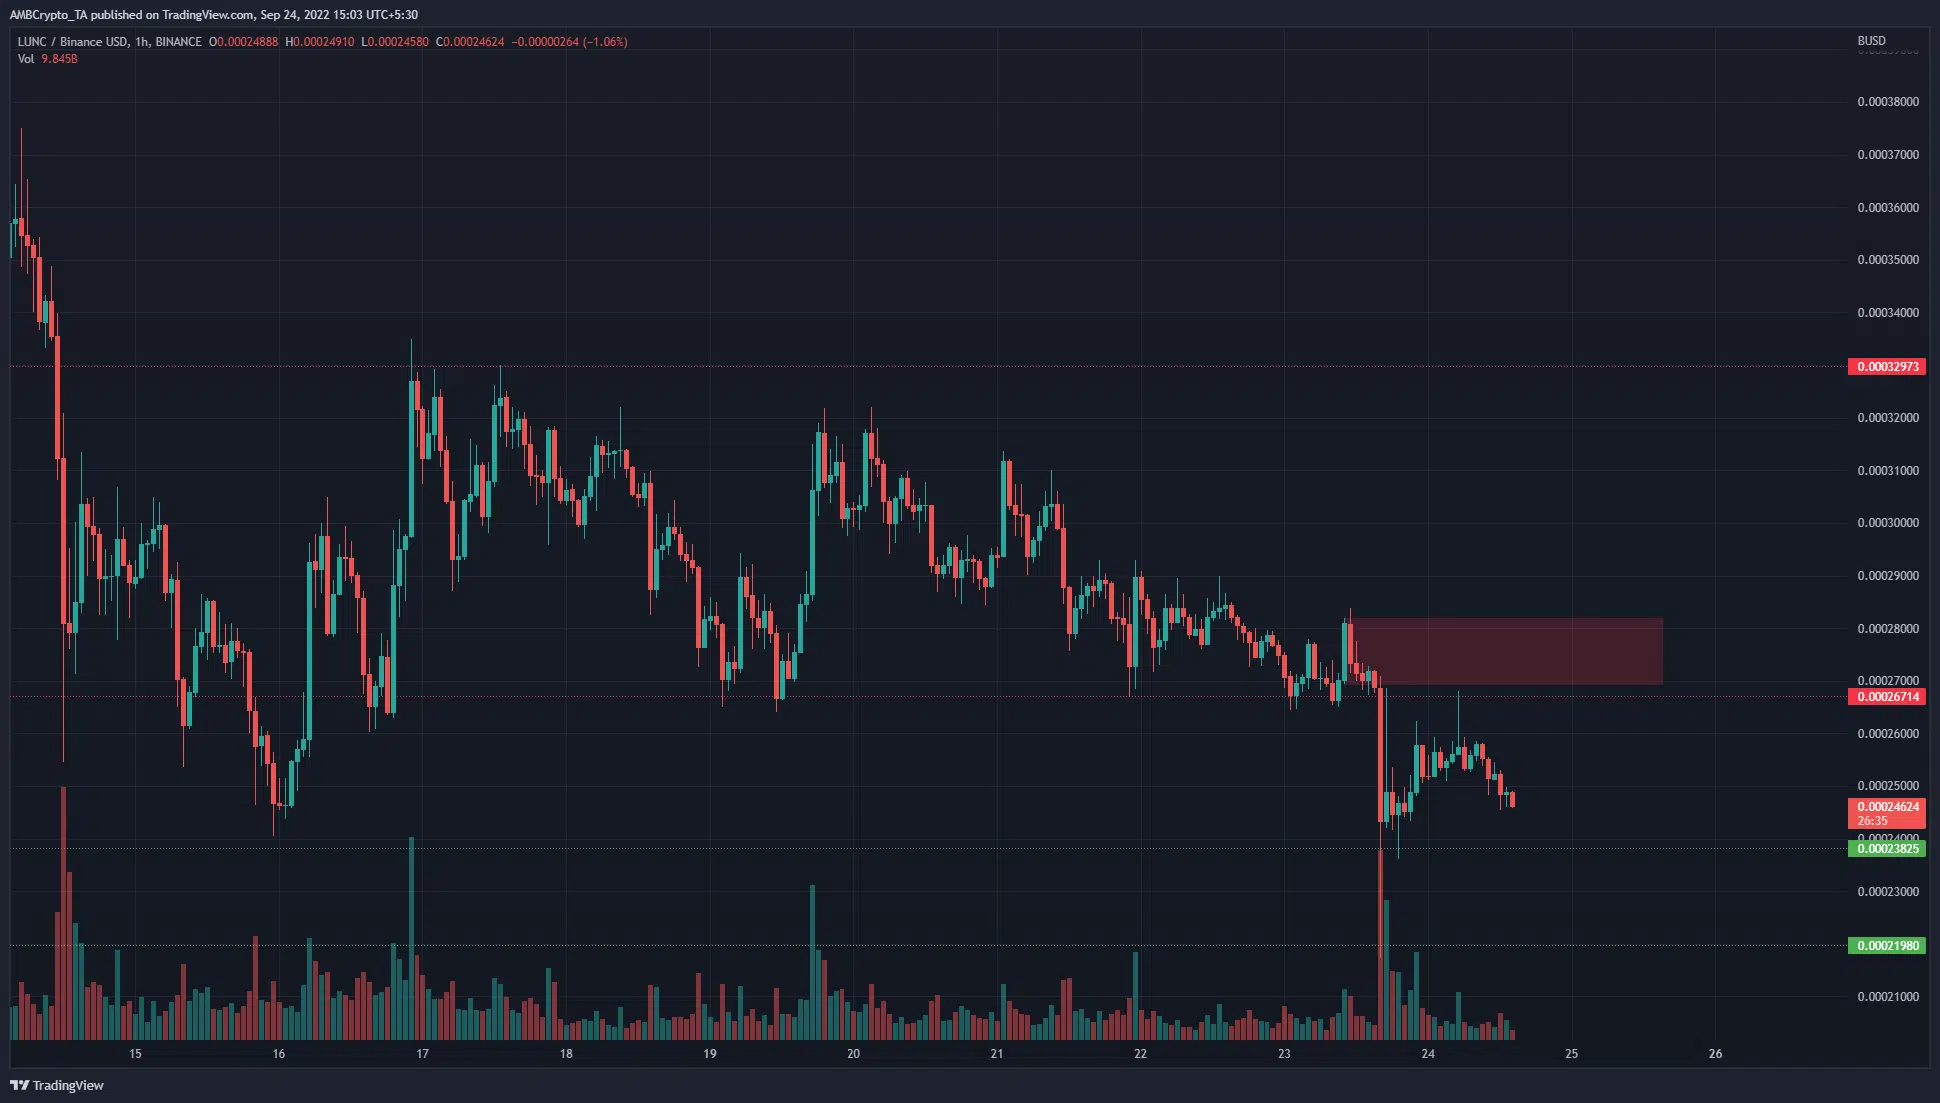
Source: LUNC/BUSD on TradingView
The short-term price chart showed a strong bearish trend in progress. The price shed 22% in the span of five days. The $0.000267 level acted as strong resistance for nearly ten days now.
But repeated retests of the same support level saw the buyers steadily lose strength. Eventually, sellers got overwhelmed with the buying pressure and forced a sharp move south as far as $0.000219.
Although this move did not see the hourly session close at those lows, the high trading volume on that session meant buyers were once more on the back foot.
At the time of writing, the price had already retested the $0.000267 level as resistance and was headed toward $0.000238.
Rationale
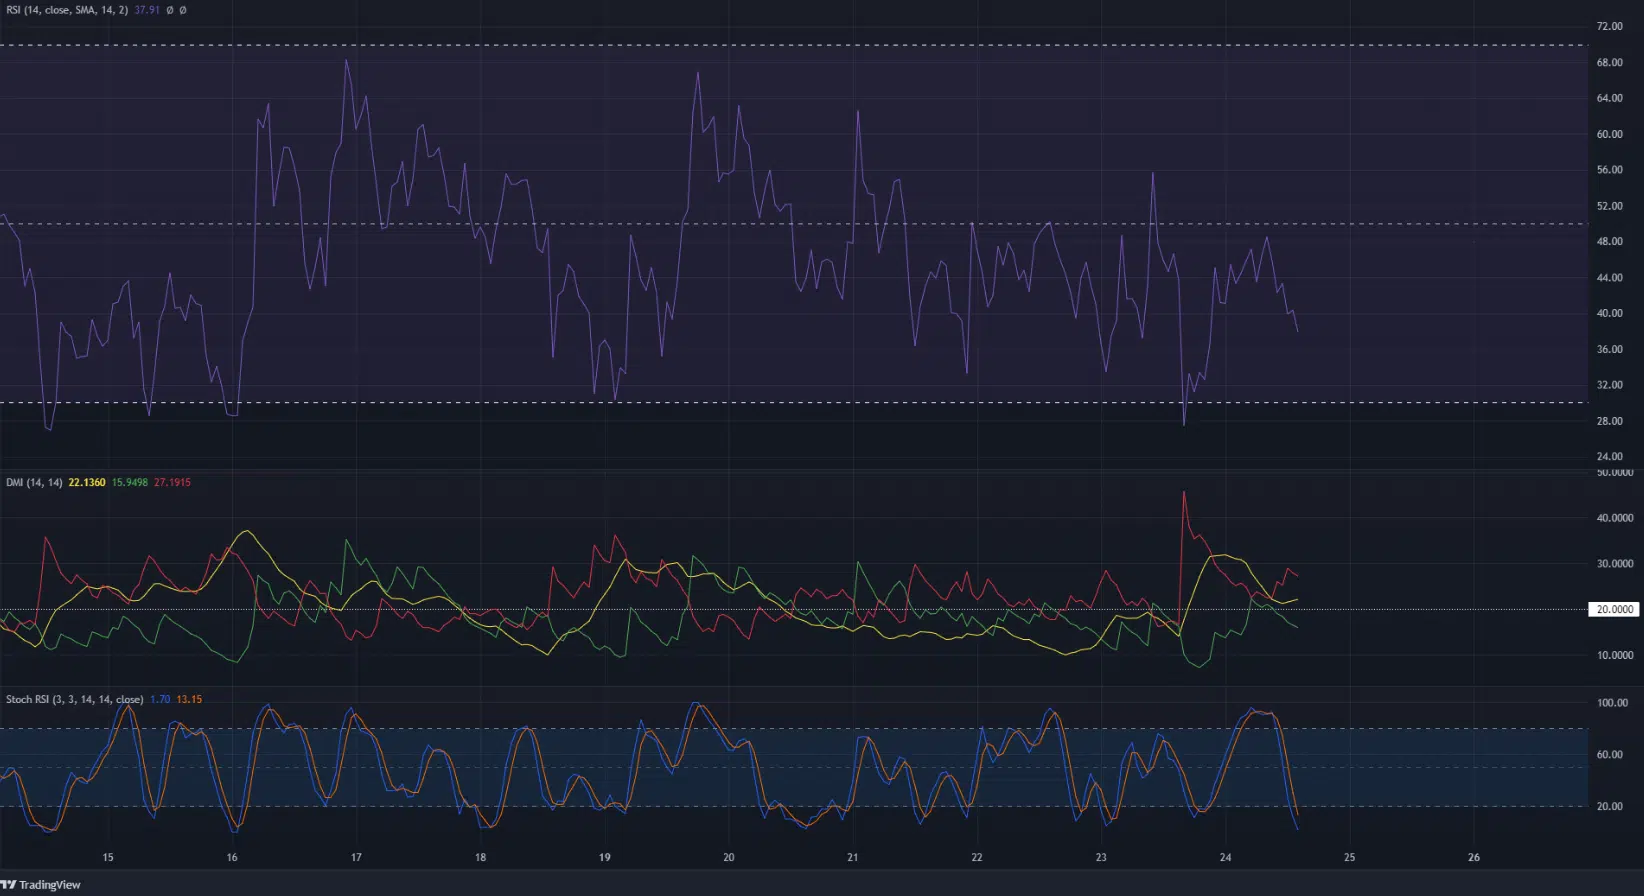
Source: LUNC/BUSD on TradingView
The Relative Strength Index (RSI) has been below the neutral 50 level over the past few days to show the presence of a strong bearish trend. Each attempt to climb past the neutral 50 mark was quickly put to the sword. The short-term momentum for LUNC would need to flip neutral 50 to support before momentum can be considered to favor the bulls.
The Directional Movement Index (DMI) also showed a strong bearish trend. The Average Directional Movement Index (ADX) (yellow) was above 20, as was the -DI (red). The Stochastic RSI, on the other hand, fell into the oversold zone. It could form a bullish crossover and climb back toward 80, but it will not signal a short-term trend reversal.
Conclusion
The bearish market structure and the strong fall beneath the $0.000267 former support was evidence that the buyers were out of ammunition. The price could see further losses in the coming days, with support lying at $0.000238 and $0.000219.