

SushiSwap (SUSHI) has broken out from a short-term descending resistance line, failing to create a bullish structure or sustain its upward movement.
SUSHI has been falling since reaching an all-time high price of $23.43 in March 2021. The downward movement has been contained inside a descending wedge, which is considered a bullish pattern.
So far, the price has reached a low of $0.92. It is currently trading at the convergence of support and resistance, so a decisive movement is likely.
Additionally, the price has reached the $0.90 horizontal support area, which coincides with the current all-time lows. Measuring from its all-time high, the price has decreased by 95%.
The weekly RSI is trading at an all-time low of 30, but it has not yet reached oversold territory.

SUSHI fails to sustain breakout
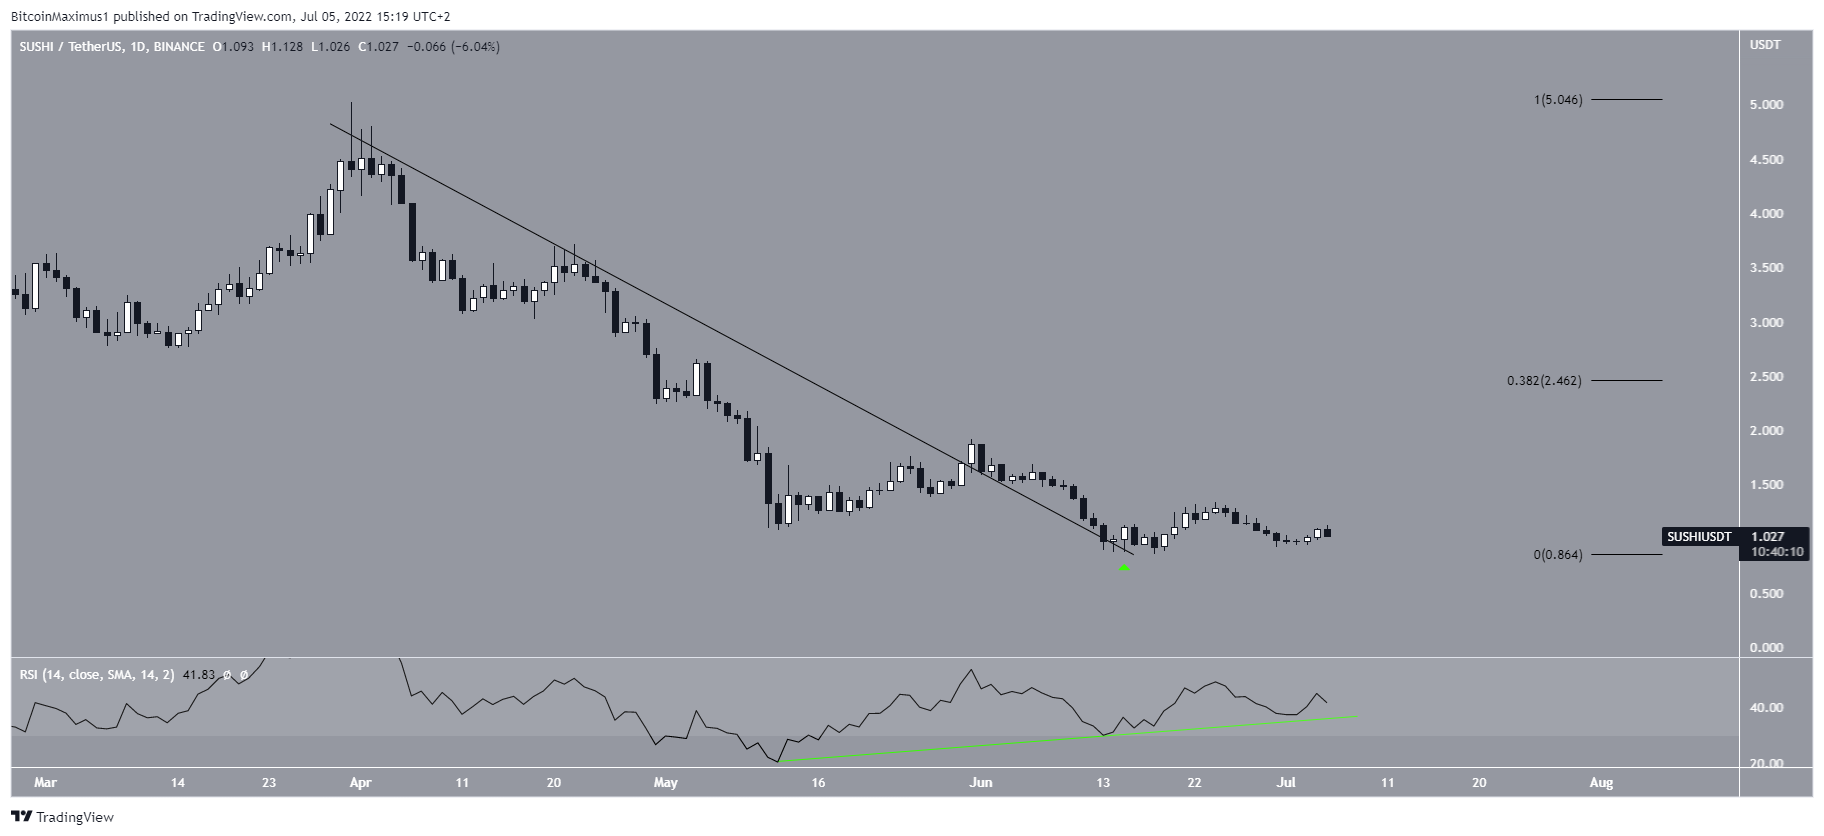
The daily chart provides a more bullish outlook, since the price has broken out from a descending resistance line. However, it failed to sustain its upward movement and returned to the resistance line once more on June 15, potentially validating it as support (green icon).
Afterwards, the daily RSI generated bullish divergence (green line). As long as the bullish divergence trend line is intact, the possibility of upward continuation remains valid.
When measuring the entire downward movement, the closest resistance area would be at $2.45, the 0.382 Fib retracement resistance level.
Wave count analysis
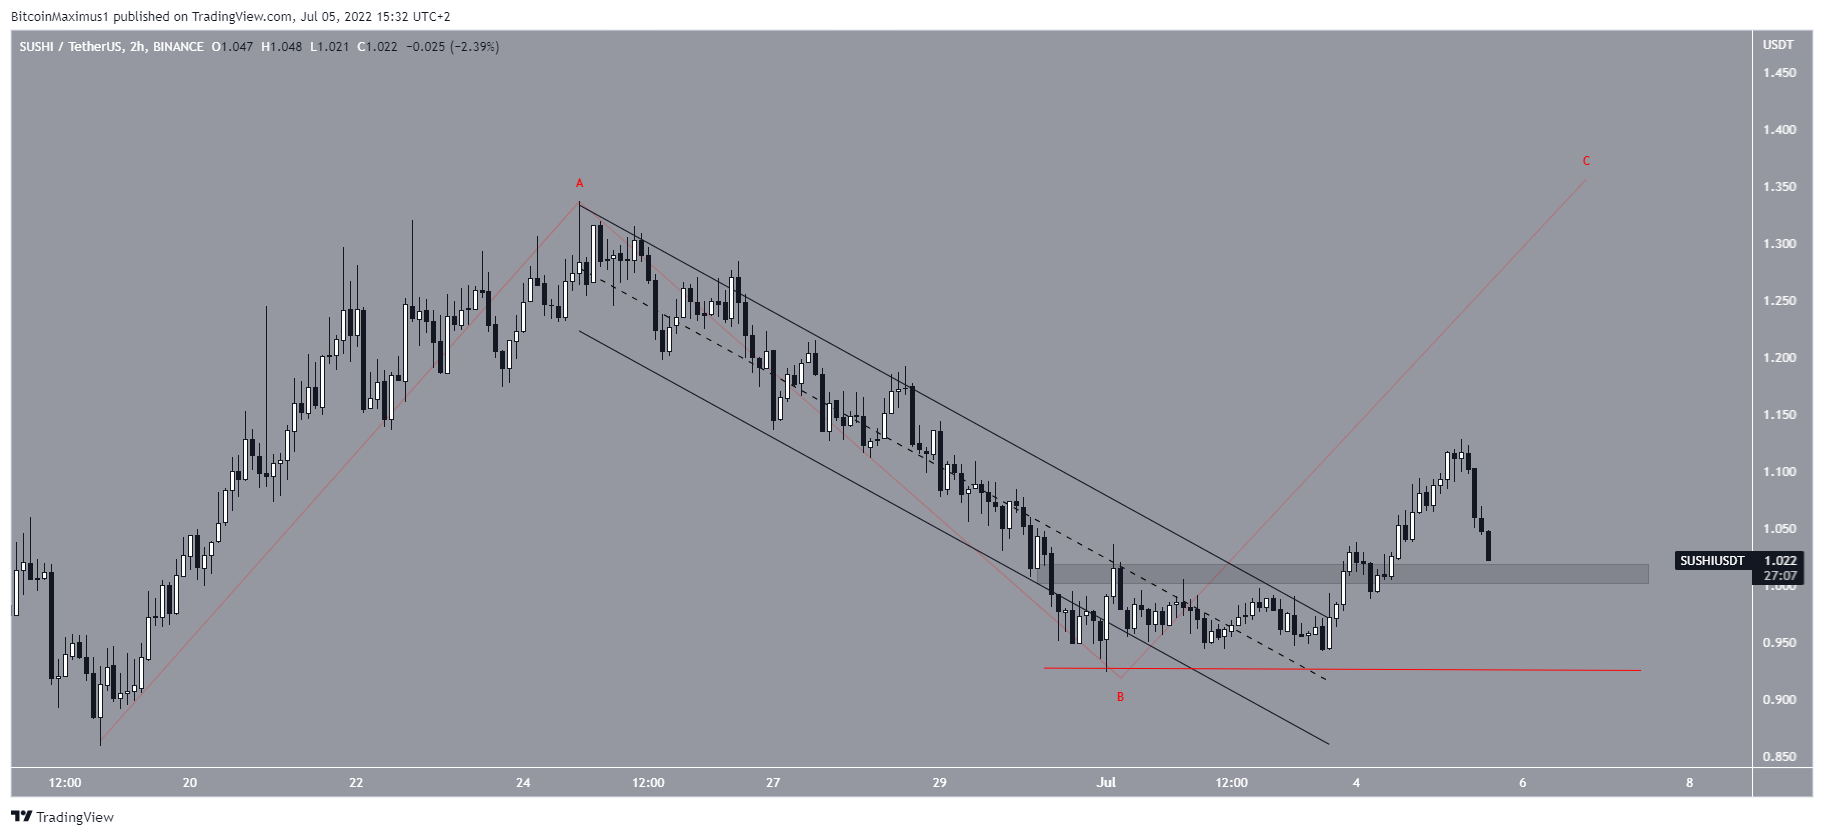
Cryptocurrency trader @Thetradinghubb tweeted a chart of SUSHI, stating that the price could increase all the way to $1.90.

Since the tweet, the price did break out from the channel, but has failed to sustain its upward movement. It has currently returned to the $1 horizontal support area.
A decrease below the B wave low (red line) at $0.92 would invalidate this particular count. This would mean that new lows below $0.86 are expected.
For Be[in]Crypto’s previous bitcoin (BTC) analysis, click here
Trusted
Disclaimer
In line with the Trust Project guidelines, this price analysis article is for informational purposes only and should not be considered financial or investment advice. BeInCrypto is committed to accurate, unbiased reporting, but market conditions are subject to change without notice. Always conduct your own research and consult with a professional before making any financial decisions. Please note that our Terms and Conditions, Privacy Policy, and Disclaimers have been updated.
